
Key Observations
With major U.S. stock indexes trading at or near all-time highs, investors may be seeking ways to reposition their portfolios against potential downside risk, while still retaining equity exposure to drive long-term returns.
- Investing in stable, high-quality companies that have consistently grown their dividends is a timeless, all-weather strategy that has delivered better risk adjusted returns vs. the broad market over time.
- The S&P 500® Dividend Aristocrats® Index has grown income at a faster rate than both the S&P 500 and high dividend yielding stocks.
- The equal-weighted Aristocrats are well positioned for the current environment, trading at attractive valuations.
Trends Come and Go—A Long-Term Perspective Is Key
Artificial intelligence is the latest disruption dominating the performance of the stock market, and it is an exciting one. But optimism for AI’s continued rise should remind us of past investment trends like the Nifty 50, dot-com stocks, and the BRICs, to name a few. They all garnered investors’ rapt attention and seemed to hold great promise… until they didn’t.
Long-term investors understand something important. Chasing the latest investment trends may lead to disappointing results, but playing the long game can lead to success.
Overlooked Amid the AI Boom?
High-quality dividend growth stocks like the Aristocrats, which have raised their dividends for a minimum of 25 consecutive years, aren’t receiving much fanfare these days. Like other dividend strategies, the Aristocrats have been lagging the S&P 500 recently. Should this trigger concerns?
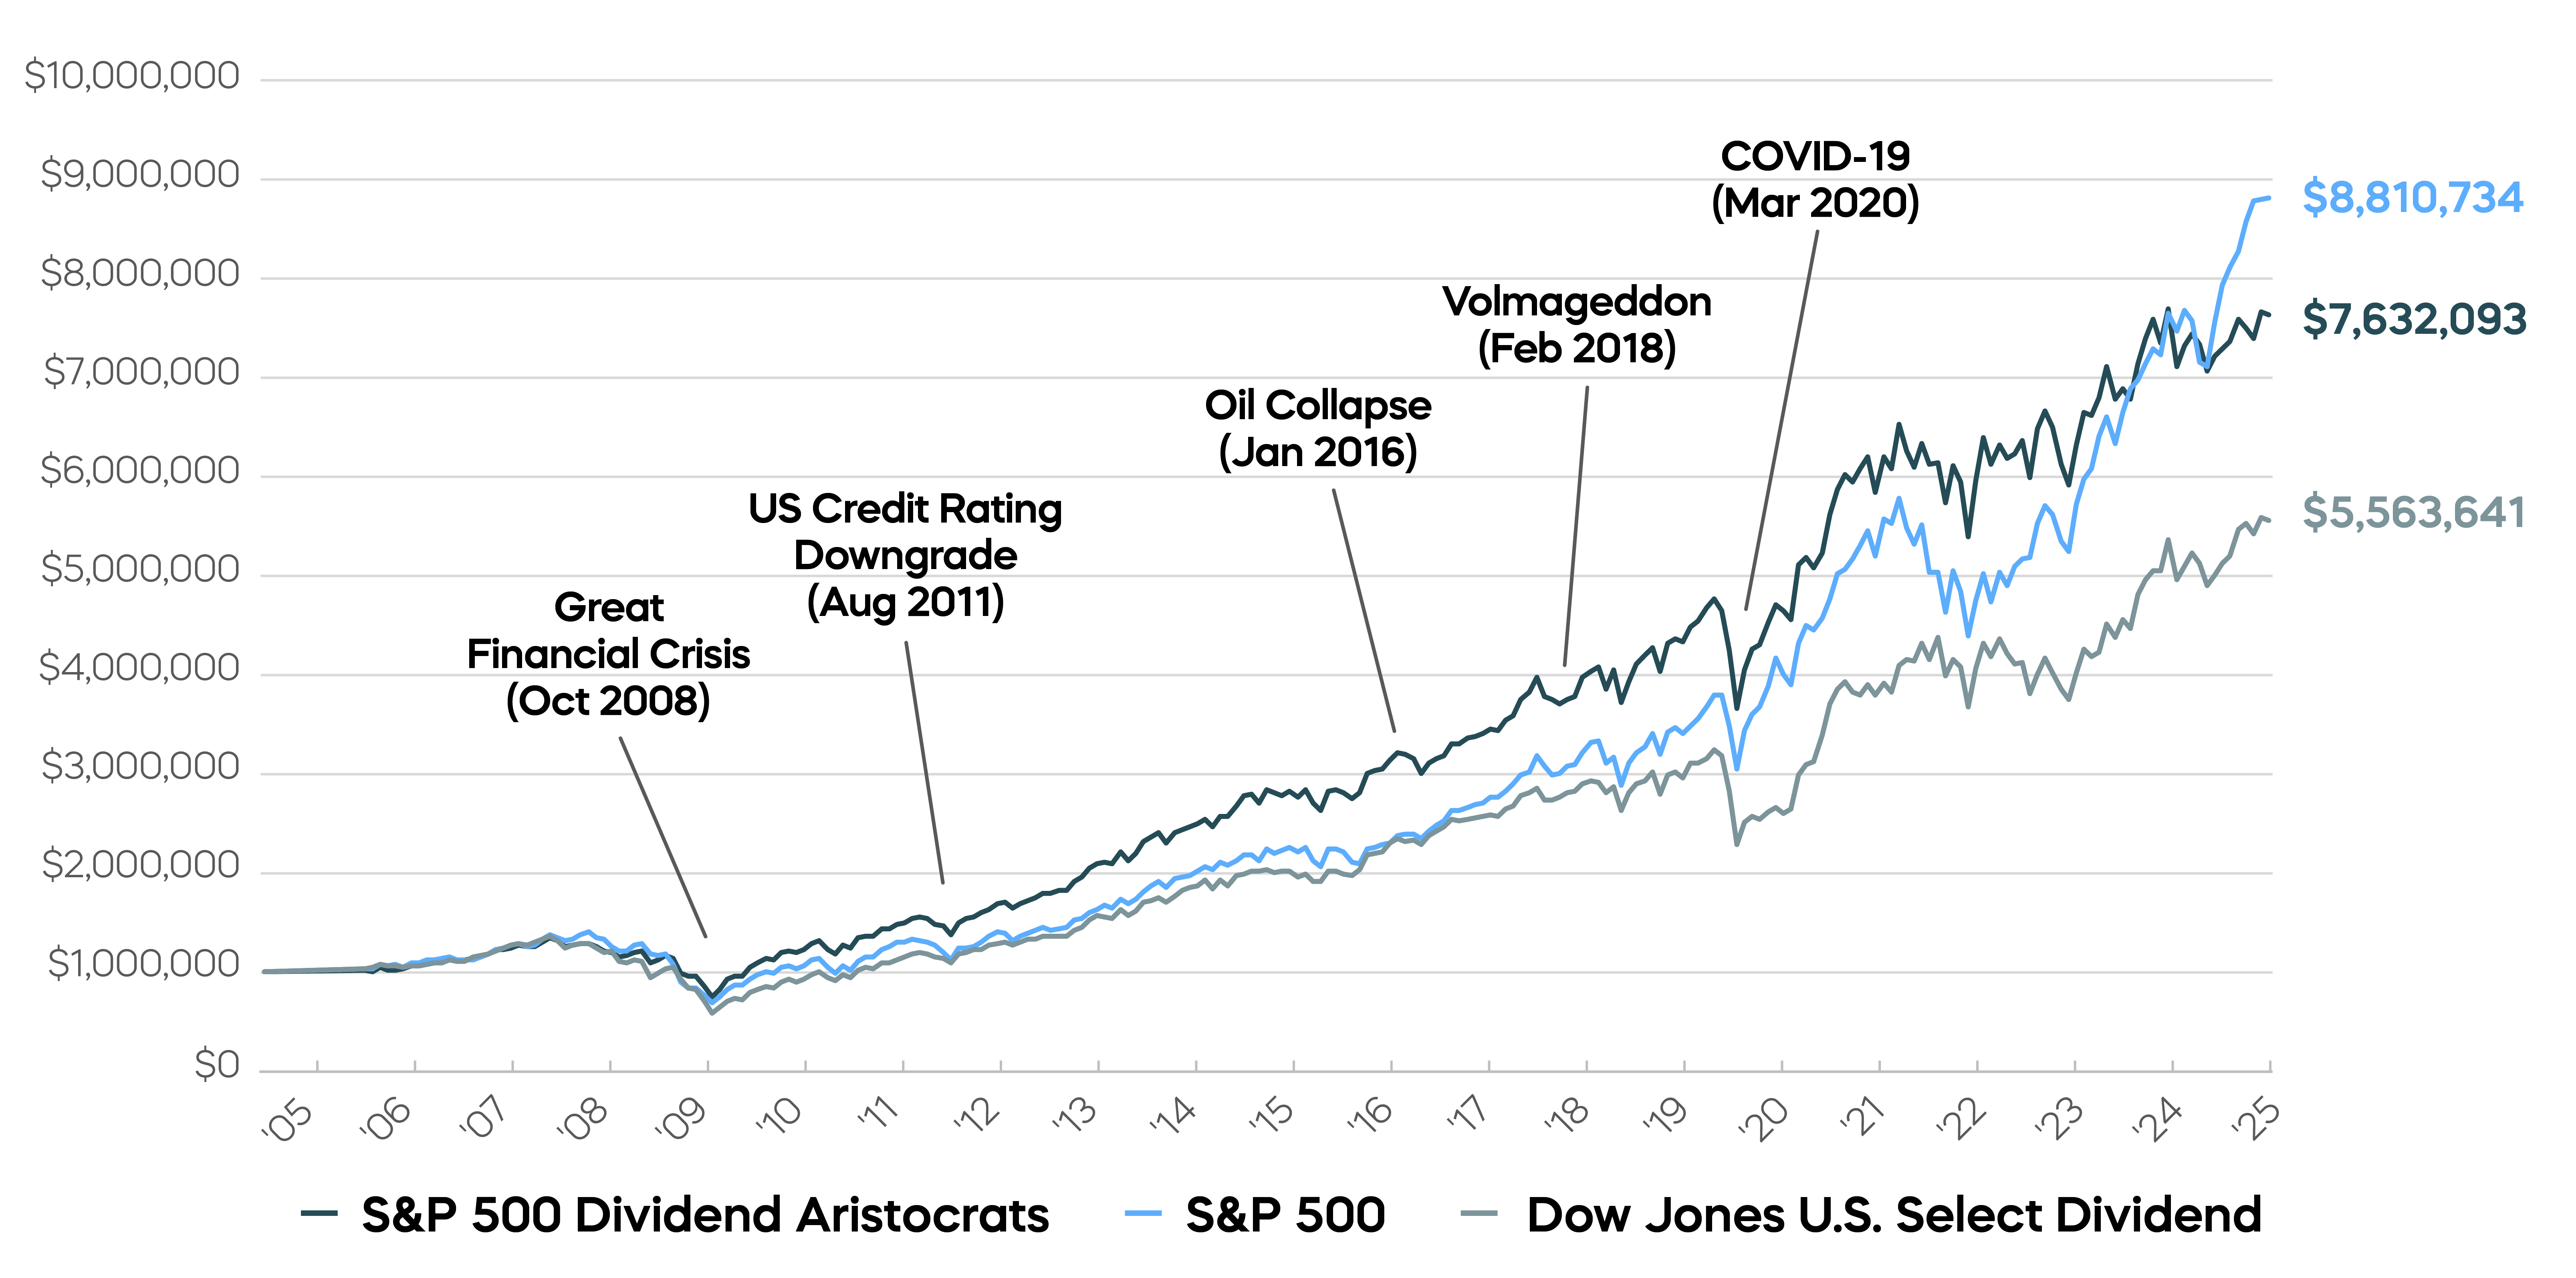
A long-term perspective suggests staying the course. The performance of the Aristocrats has remained stellar over time. Since inception in May 2005, the S&P 500 Dividend Aristocrats Index has better risk adjusted returns vs. the S&P 500, with lower levels of volatility. The Aristocrats, with their decades-long dividend histories, have helped to grow and maintain wealth through the inevitable ups and downs of market cycles.
- Hypothetically, a $1 million investment at the inception of the S&P 500 Dividend Aristocrats Index would have grown to $7.6 million by December 31, 2025.
- That amount significantly outpaced the growth of high-dividend yield stocks, represented by the Dow Jones U.S. Select Dividend Index on the following chart.
The Aristocrats Have Endured Disruptions and Outperformed with Less Volatility
More Income—and Faster Growth, Too
Another, often underappreciated, feature of a dividend growth strategy is compounding income growth over time. Rather than narrowly focusing on high levels of current yield, investors may want to consider the durability and superior historical rate of income growth of the Aristocrats. The effect of this growth rate over time has been powerful. Let’s look again at our hypothetical $1 million investment.
- The yield of the annual dividends produced by the Aristocrats in 2025, expressed as a percentageof the original investment—the "yield on cost"—was nearly 11%. And we believe it is poised to continue growing.
- Moreover, the cumulative dividends earned would have exceeded not only those of the high-dividend yielders and the broader market—they would have exceeded the original investment.
The Aristocrats Have Outgrown and Outearned High Dividend Yielders
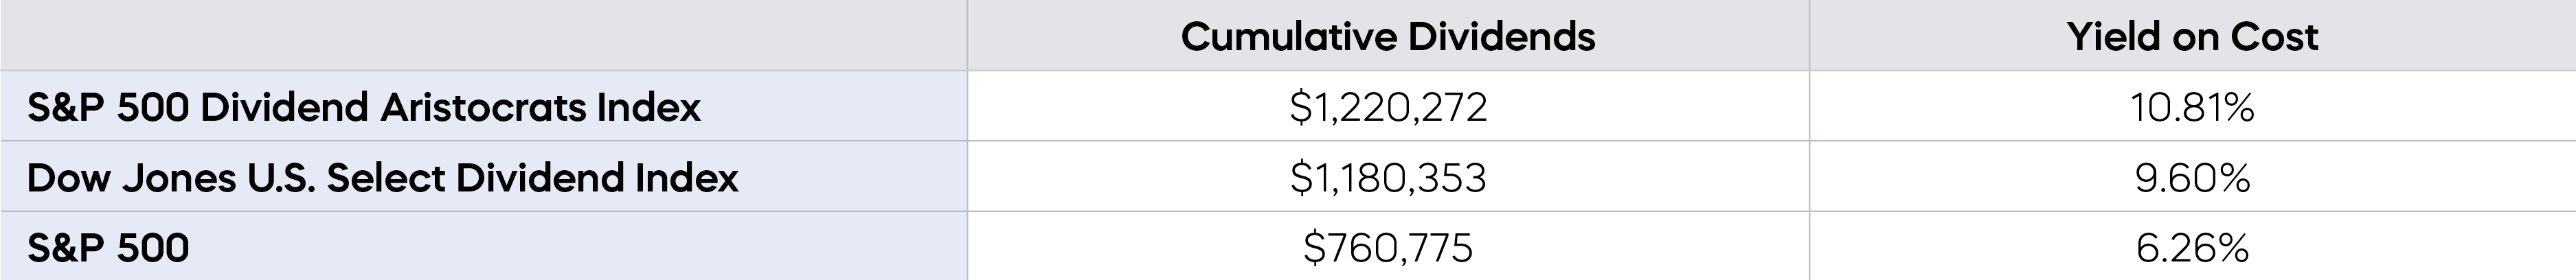
Source: Bloomberg and S&P, 1/1/06-12/31/25. 2025 dividend is annualized. "Yield on cost" measures dividend yield based on the original purchase price of a stock, and it can grow significantly over time if a company regularly increases its dividend. Index returns are for illustrative purposes only and do not reflect any management fees, transaction costs or expenses. Indexes are unmanaged, and one cannot invest directly in an index. Past performance does not guarantee future results.
The Aristocrats Are “On Sale” and May Be Poised for a Comeback
Much of the rally in S&P 500 from its recent lows in October 2023 was accompanied by unusually low levels of volatility. That may be changing, though. Volatility has seemingly returned and could be with us for a while as investors continue to grapple with election uncertainties, and potentially slowing economic growth.
- For investors seeking some all-weather stability, the S&P 500 Dividend Aristocrats Index has historically delivered 87% of the market’s upside performance, with only 84% of the downside.[1]
- Currently, the Aristocrats are trading more than 20% below the price-to-earnings multiple of the S&P 500—a discount level that’s historically been followed by an extended period of outperformance.[2]
Further, recent market trends have resulted in a growing concentration risk in the broad, cap-weighted S&P 500. The diversified, equal-weighted approach of the Dividend
Aristocrats nearly eliminates this risk.
- The top 10 performing stocks in the S&P 500 delivered 55% of the index’s returns in 2025.[3]
- All 69 stocks in the equally weighted S&P 500 Dividend Aristocrats Index, by contrast, have the potential to contribute their fair share to performance, improving diversification* and risk management.
The Takeaway
Trends come and go, but maximizing success often requires investors to maintain a long-term perspective. The S&P 500 Dividend Aristocrats Index has outperformed the S&P 500 and high dividend yield strategies over time, and delivered faster income growth. The Aristocrats’ strategy has delivered for investors, even through volatile markets, and is currently trading at discounted valuation levels. Its equal-weighted approach also provides a timely alternative to market-cap-based strategies, which have become highly concentrated over the past couple of years. The S&P 500 Dividend Aristocrats strategy could be a potentially compelling choice in the current market environment.
Is There an ETF That Tracks the S&P 500 Dividend Aristocrats?
You can invest in the Dividend Aristocrats through ProShares S&P 500 Dividend Aristocrats ETF (NOBL), the only ETF focused exclusively on the S&P 500 Dividend Aristocrats—high-quality companies that have not just paid dividends but grown them for at least 25 consecutive years, with most doing so for 40 years or more.
Often household names, NOBL’s holdings generally have had stable earnings, solid fundamentals, and strong histories of profit and growth. NOBL’s strategy has allowed investors to capture most of the gains of rising markets, and less of the loss in falling markets.[4]
About Us
ProShares now offers one of the largest lineups of ETFs, with over $90 billion in assets. The company is a leader in strategies such as crypto-linked, dividend growth, interest rate hedged bond and geared (leveraged and inverse) ETF investing. ProShares continues to innovate with products that provide strategic and tactical opportunities for investors to manage risk and enhance returns.
*Diversification does not ensure a profit or guarantee against a loss.
1. Morningstar, data from 5/2/05 to 12/31/25. “Up capture ratio” measures the performance of a fund or index relative to a benchmark when that benchmark has risen. “Down capture ratio” measures performance during periods when the benchmark has declined. Ratios are calculated by dividing monthly returns for the fund’s index by the monthly returns of the primary index during the stated time period and multiplying that factor by 100.
2. Bloomberg, based on an analysis of data from 6/30/05–12/31/25
3. FactSet, as of 12/31/25
4. Morningstar, 5/2/05 - 12/31/25
Learn More
NOBL
S&P 500 Dividend Aristocrats ETF
Seeks investment results, before fees and expenses, that track the performance of the S&P 500® Dividend Aristocrats® Index.
REGL
S&P MidCap 400 Dividend Aristocrats ETF
Seeks investment results, before fees and expenses, that track the performance of the S&P MidCap 400® Dividend Aristocrats® Index.
SMDV
Russell 2000 Dividend Growers ETF
Seeks investment results, before fees and expenses, that track the performance of the Russell 2000® Dividend Growth Index.