Key Observations

Stocks hate uncertainty, and there are plenty of reasons to feel unsure right now. President Trump’s new, far-reaching swath of tariffs, government sector layoffs, geopolitical challenges, and more have increased volatility in the short term and placed significant pressure on stock prices.
Prior to this past week’s broad selloff, the epicenter of recent pullbacks has largely been the technology sector. The S&P 500 tech sector fell nearly 13% through the end of March. At nearly 30% of the weight of the S&P 500, the technology sector is large—in fact, it is as large as it was at its previous peak near the end of the last century—and its impact on market direction is meaningful.
At the same time, corporations and consumers now face the fallout from the President’s tariff policies announced on April 2nd. The most meaningful unknown may be how severe the tariff fight could become, and how long it might last. Investors should keep a close eye on the fundamentals underpinning the U.S. economy, recession risks, and on divergent reactions across global bond yields as international trade rules are rewritten.
Chart of the Month
The Information Technology Sector Has Been Nearly 30% of the S&P 500
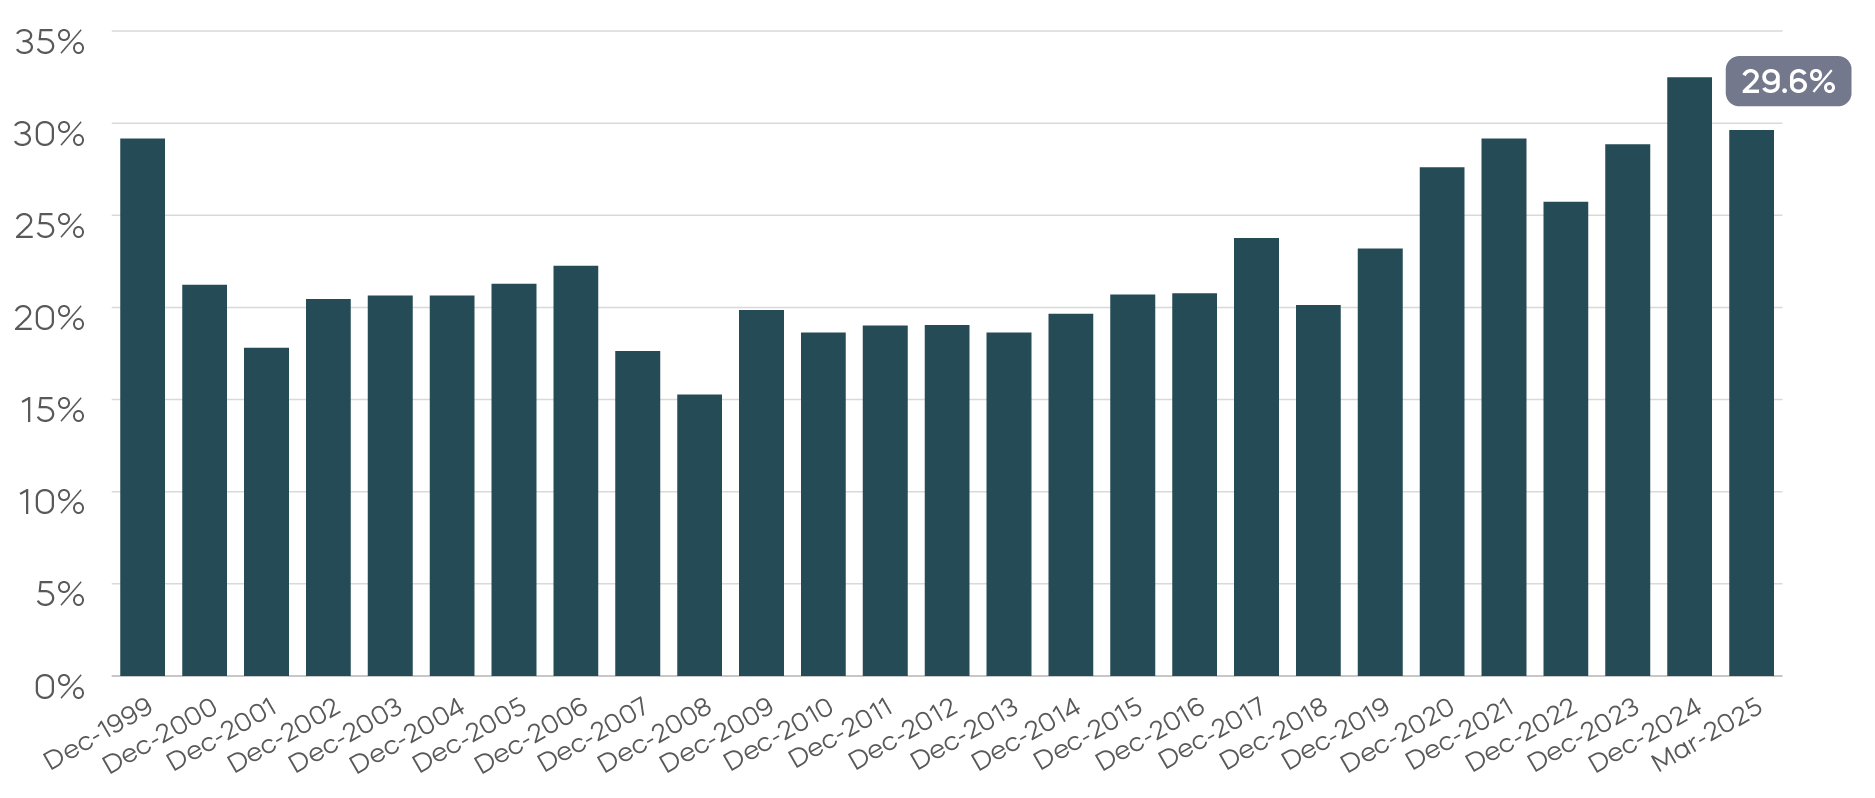
Source: Bloomberg. Data from 12/31/19–3/31/25.
That size alone points to elevated sector risk from technology exposure, but there is another side to the story. If we look back to the end of 1999, the price-to-book ratio[1] of the tech sector was 12-13 times—roughly the same as it is today—and the price-to-earnings ratio (P/E)[2] was over 60. Tech’s P/E today stands at about 30, which means the sector generates roughly double the amount of earnings per invested dollar. Not only is the tech sector large, but it has been quite profitable recently. For investors re-thinking their exposure, here are two ideas for consideration.
For the bold, or those with other substantial technology holdings, the S&P 500 Ex-Information Technology Index provides a simple strategy for S&P 500 exposure that omits the technology sector. The S&P ex-tech index outperformed the S&P 500 by about 4% this year through the end of March.
Another idea could be to apply an old school approach in a bit of a new way. For investors seeking prudent exposure to technology stocks, consider the S&P Technology Dividend Aristocrats.
Consistent dividend growth—a timeless marker of quality—can work quite well for technology stocks. Consistent dividend growth is a vital signal that a company has confidence in its future. The S&P Technology Dividend Aristocrats Index, which focuses on technology-related names that have consistently raised dividends for at least seven years, outperformed the S&P 500 tech sector by over 8% this year through the end of March.
Performance Recap
Risk-off sentiment continued for U.S. equities during March, as stocks declined across large-, mid-, and small-cap segments. By contrast, international stocks outperformed, and commodities gained amid previous tariff concerns, becoming the top-performing asset class year to date.
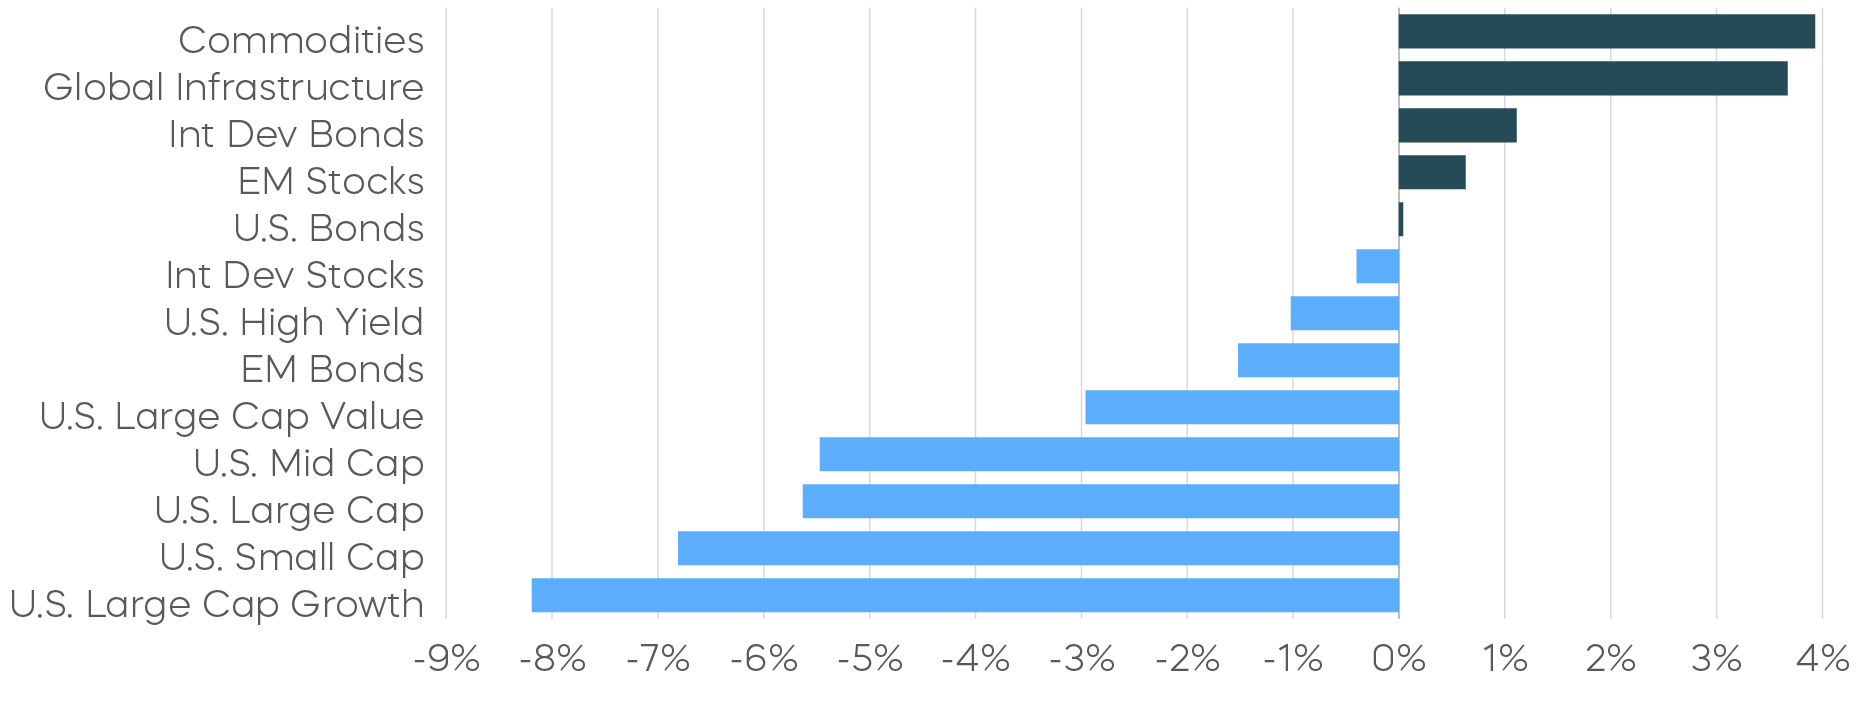
Asset Class Returns—March 2025
Asset Class Returns—Year to Date
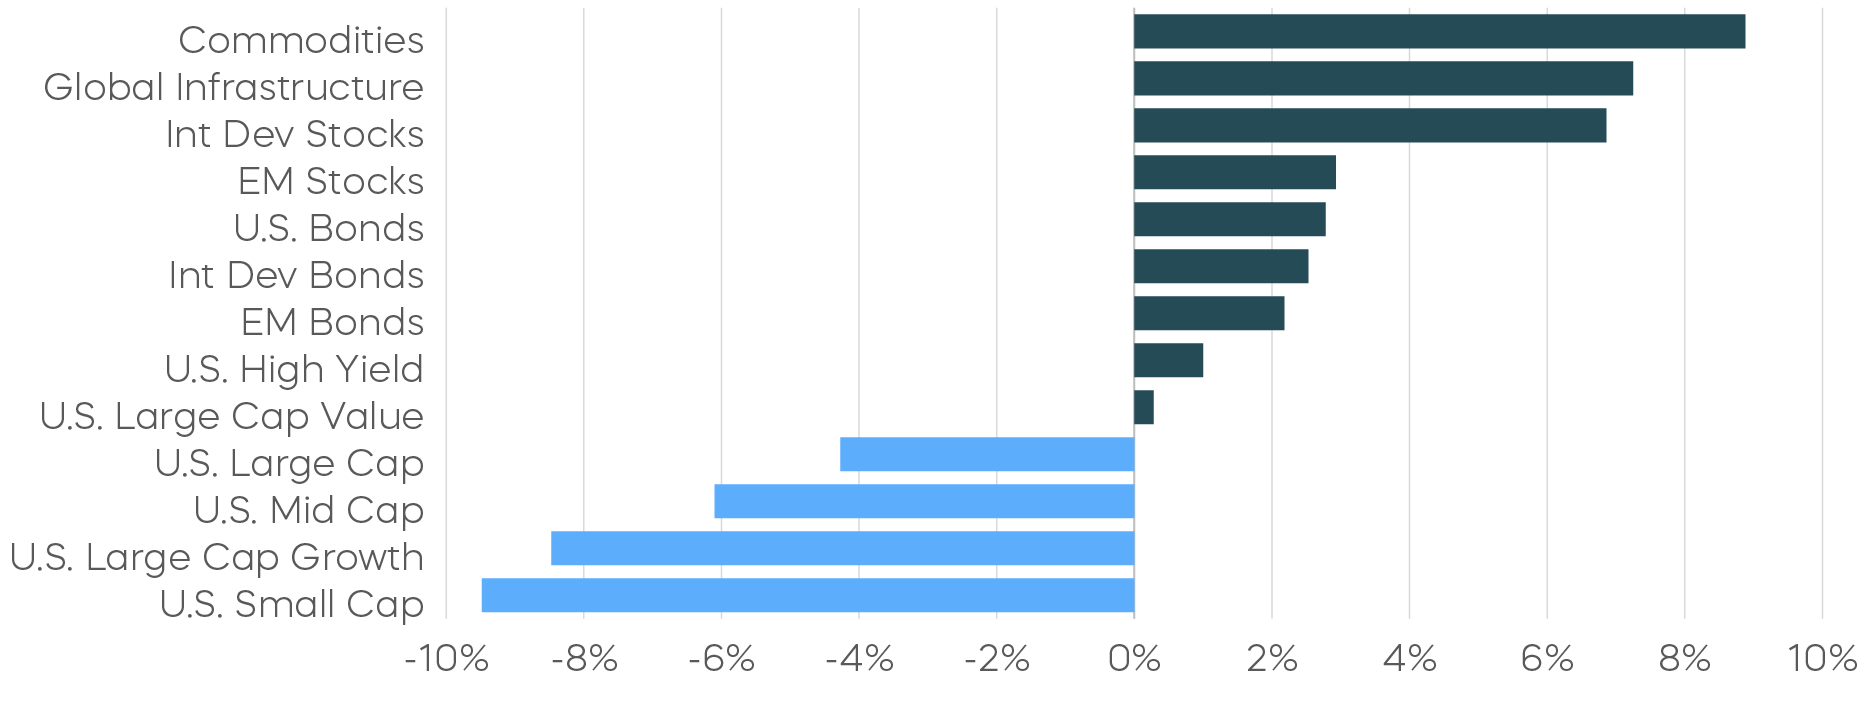
Source: Bloomberg. March returns 3/1/25–3/31/25; year-to-date returns 1/1/25‒3/31/25. Index returns are for illustrative purposes only and do not reflect any management fees, transaction costs or expenses. Indexes are unmanaged, and one cannot invest directly in an index. Past performance does not guarantee future results.
Economic Calendar
Here is a list of key and upcoming economic releases, which may serve as a guide to potential market indicators.
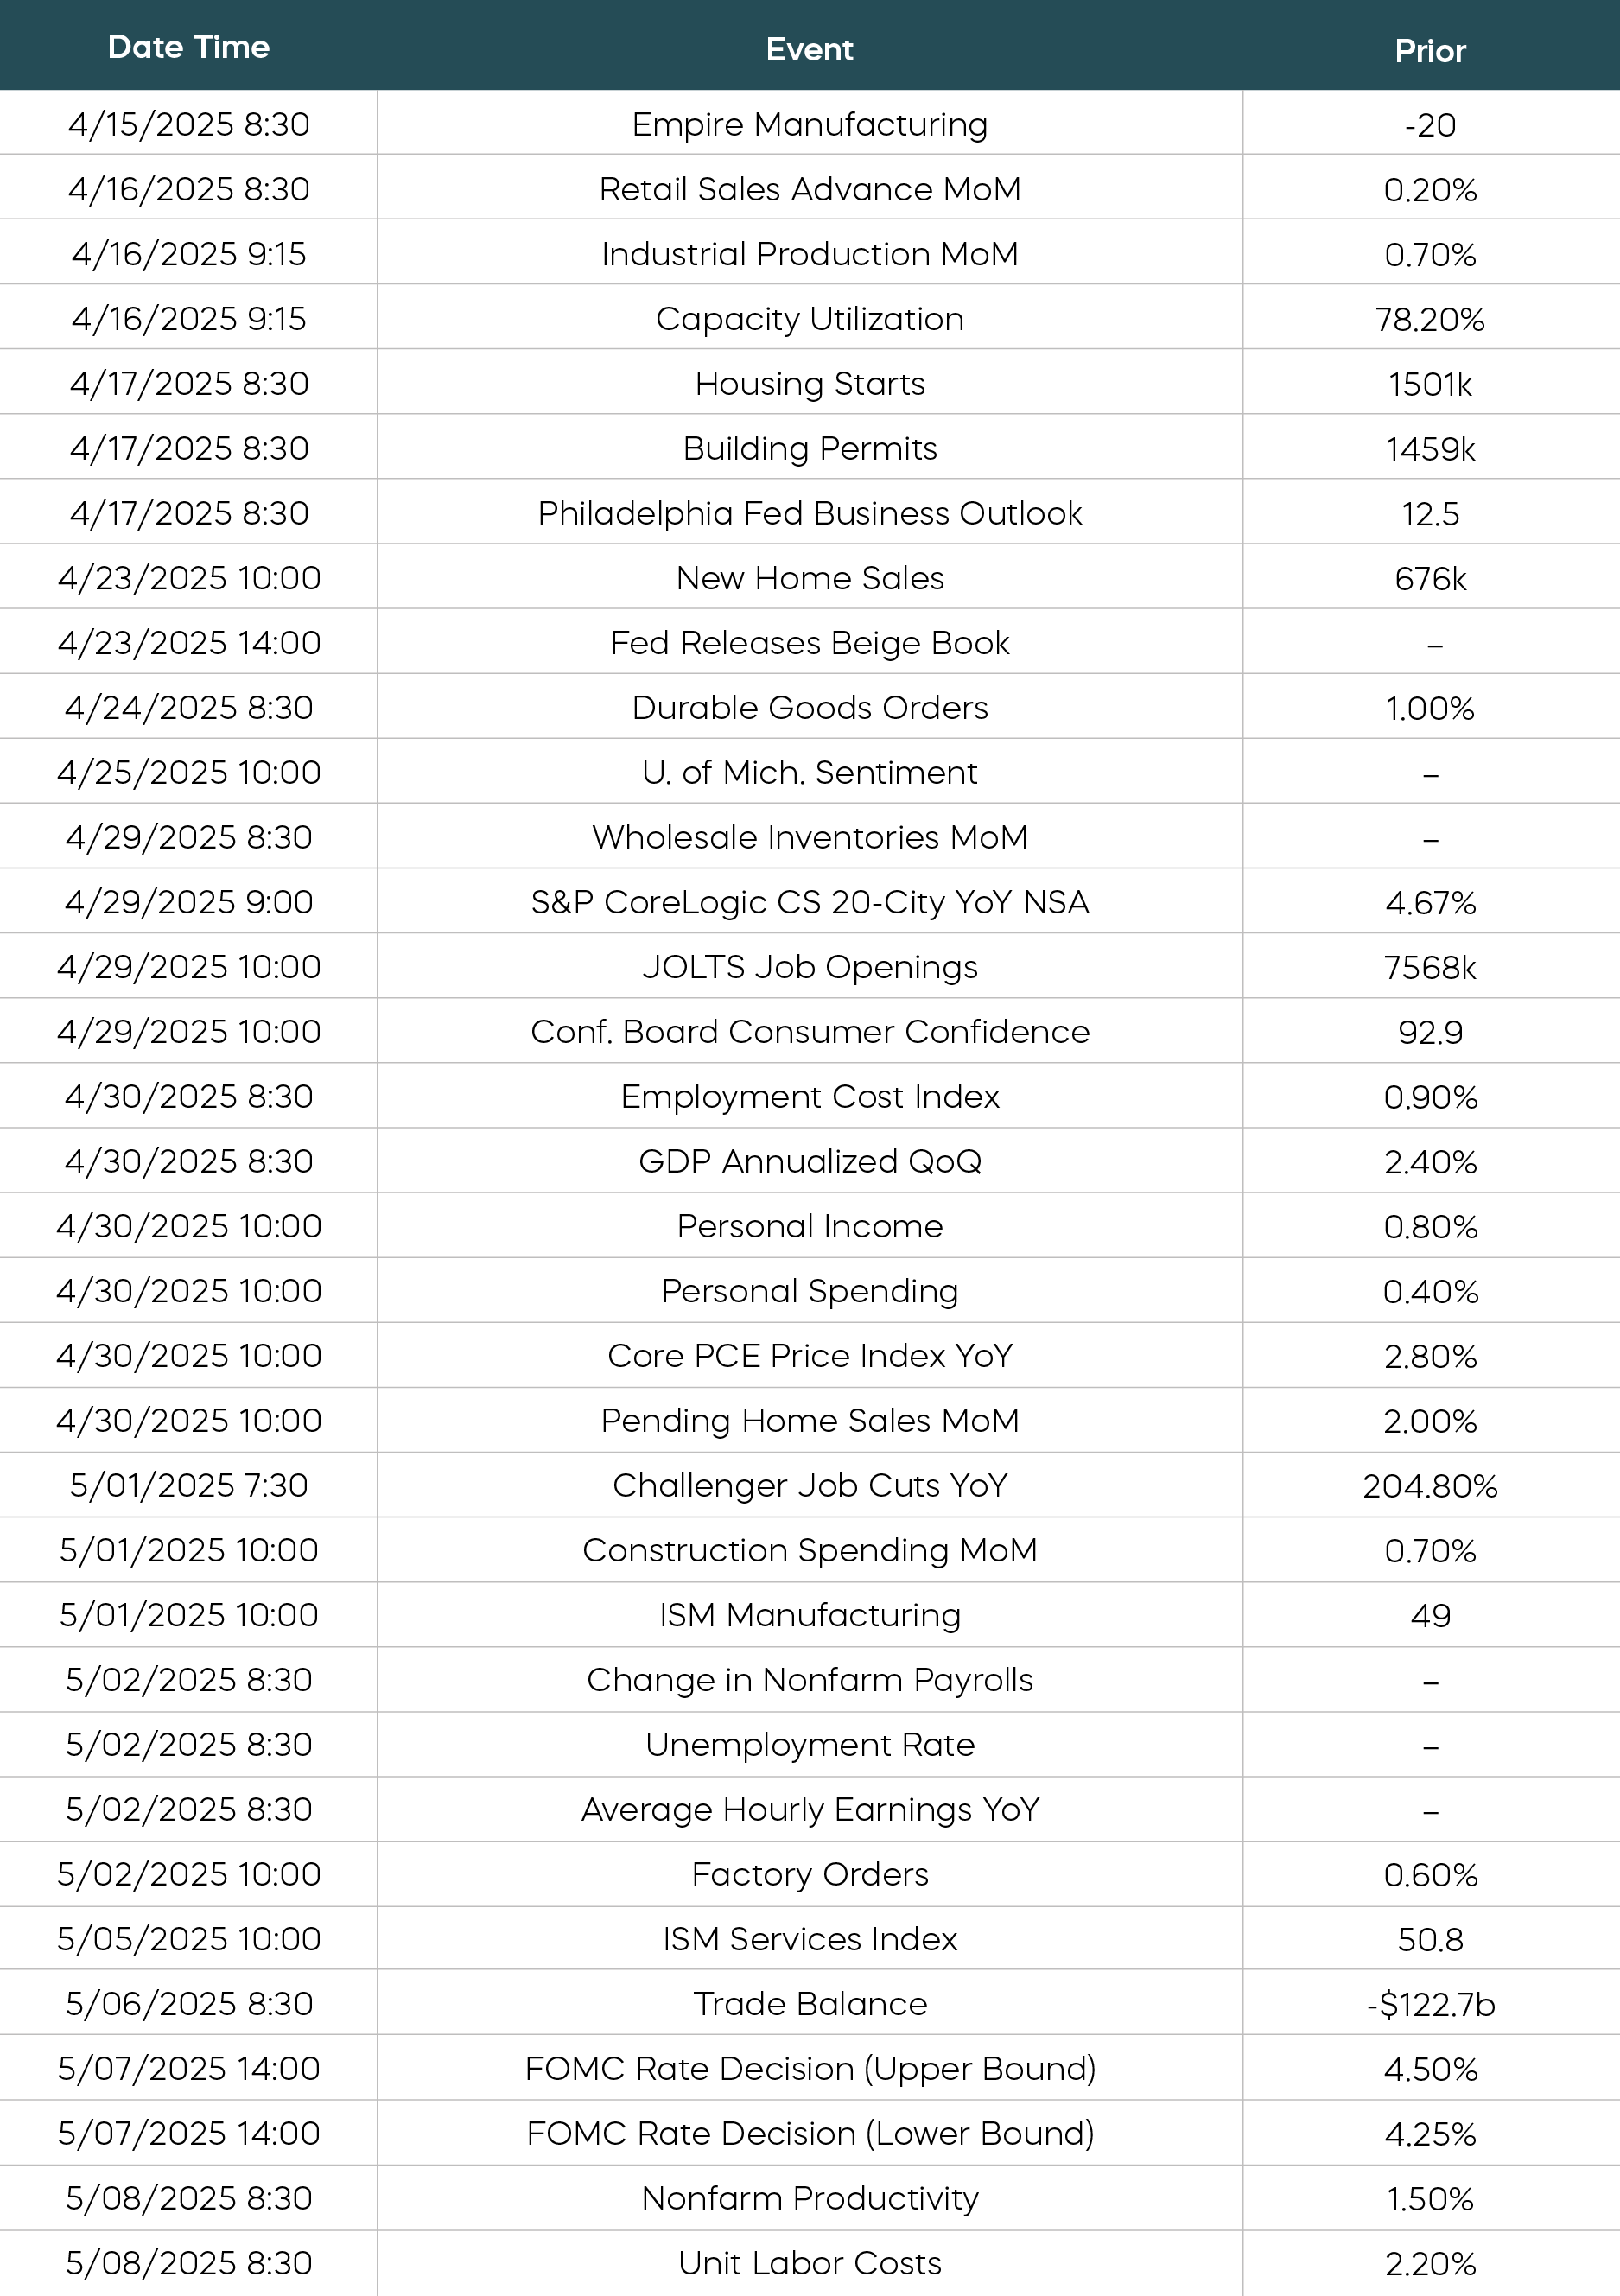
Source: Bloomberg. Data as of 4/2/25.
Equity Perspectives

What’s Working Now?
As investment strategists, we visit clients and often see first-hand the challenges of investing in uncertain times. During a recent trip to Minnesota, I heard a common refrain: “What’s working now?”
It’s easy to understand that sentiment. Just about all the major equity indexes—including the S&P 500, the S&P MidCap 400, the Russell 2000, the Nasdaq-100, and the Dow Jones Industrial Average—all produced negative returns for the month of March and the first quarter. It seems like nothing is working.
At the same time, many investors have become accustomed to relying on just a handful of market pillars—notably large-cap growth-oriented technology stocks with momentum—to support their portfolios for the last several years. When these narrow segments of the market stop working, it can present a challenge.
The technology sector dropped 12.7% for the first quarter and, due to its relative weight, accounted for just about all of the S&P 500’s 4.3% decline. But seven other sectors produced positive returns during the first quarter. Diversification beyond the heavily concentrated technology sector is typically a wise decision in the long run.
Dividend Aristocrats Have Delivered All-Weather Performance
One way to identify potential outperformers in this volatile market may be to look through the lens of factors. Factor investing has been around for decades and involves targeting specific characteristics or “factors” that are unique sources of risk and return. Over the past several years, factors like growth, momentum and high beta have been the market leaders. But, like technology stocks, they have lagged in 2025 as leadership shifted.
Dividend Aristocrats Have Had Positive Returns in 2025 Through March
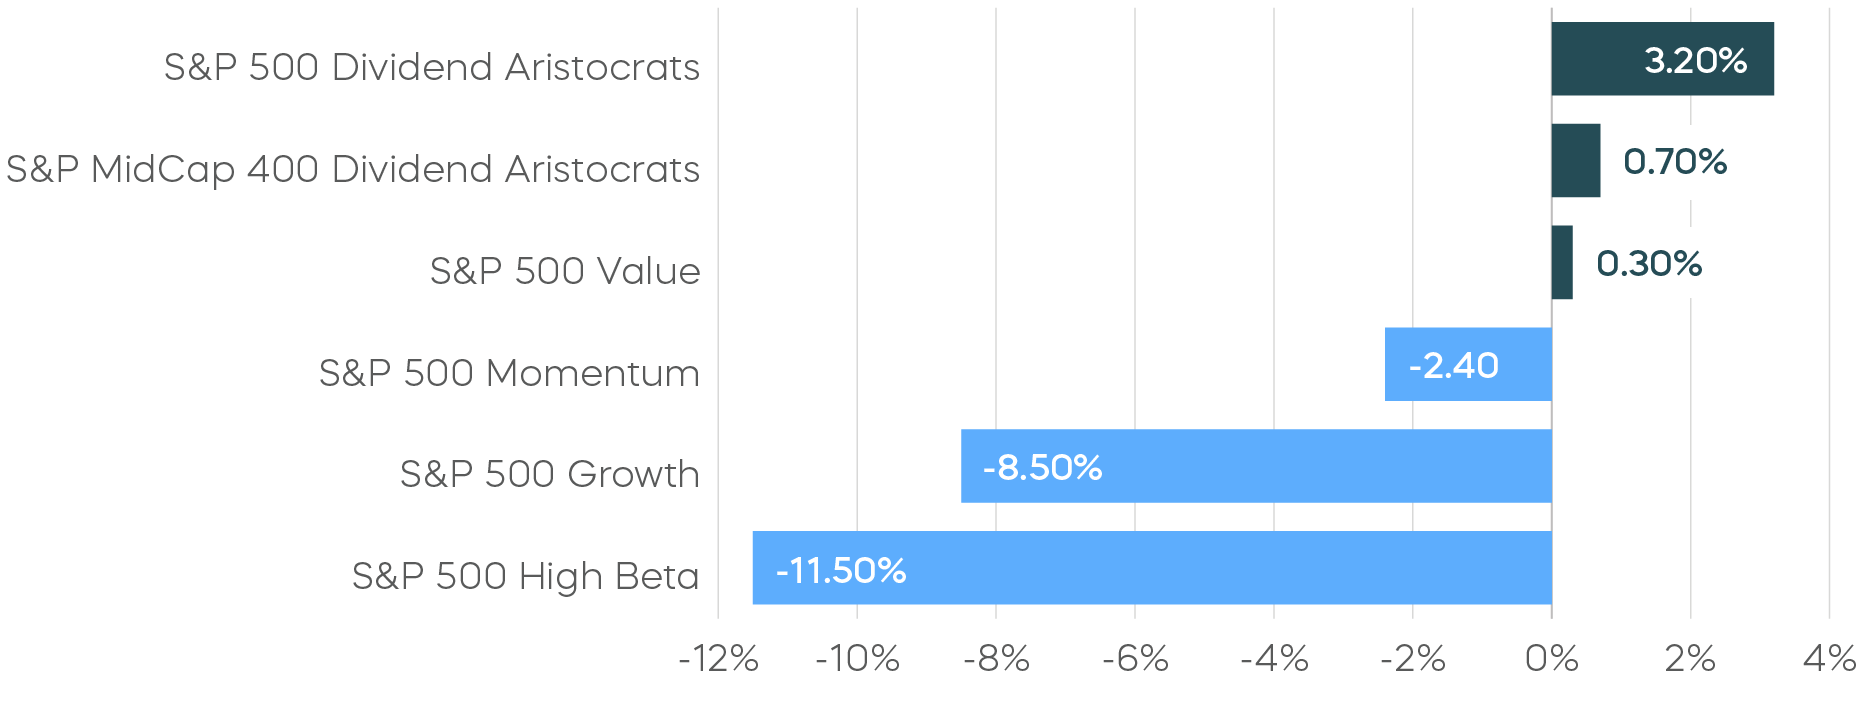
Source: Morningstar. Data from 1/1/25–3/31/25. Index returns are for illustrative purposes only and do not reflect any management fees, transaction costs or expenses. Indexes are unmanaged, and one cannot invest directly in an index. Past performance does not guarantee future results.
What worked during the first quarter were factors that previously lagged. Value stocks produced modest gains through March, and dividend growth strategies like the Dividend Aristocrats worked even better. In a first-quarter market searching for leadership, the large- and mid-cap Dividend Aristocrats delivered all weather performance.
An obvious antidote for uncertainty is, of course, greater certainty. High-quality companies that continually grow their dividends are sending a powerful signal that they will be able to weather market turbulence despite myriad uncertainties bogging down the market.
Fixed Income Perspectives

Treasury bond yields declined, and credit spreads widened as investors retreated from risk assets in March. Investment-grade corporate bond index spreads widened 7 basis points, while high-yield bond index spreads widened 67 basis points to 347 during the month.
Fixed Income Returns—March 2025
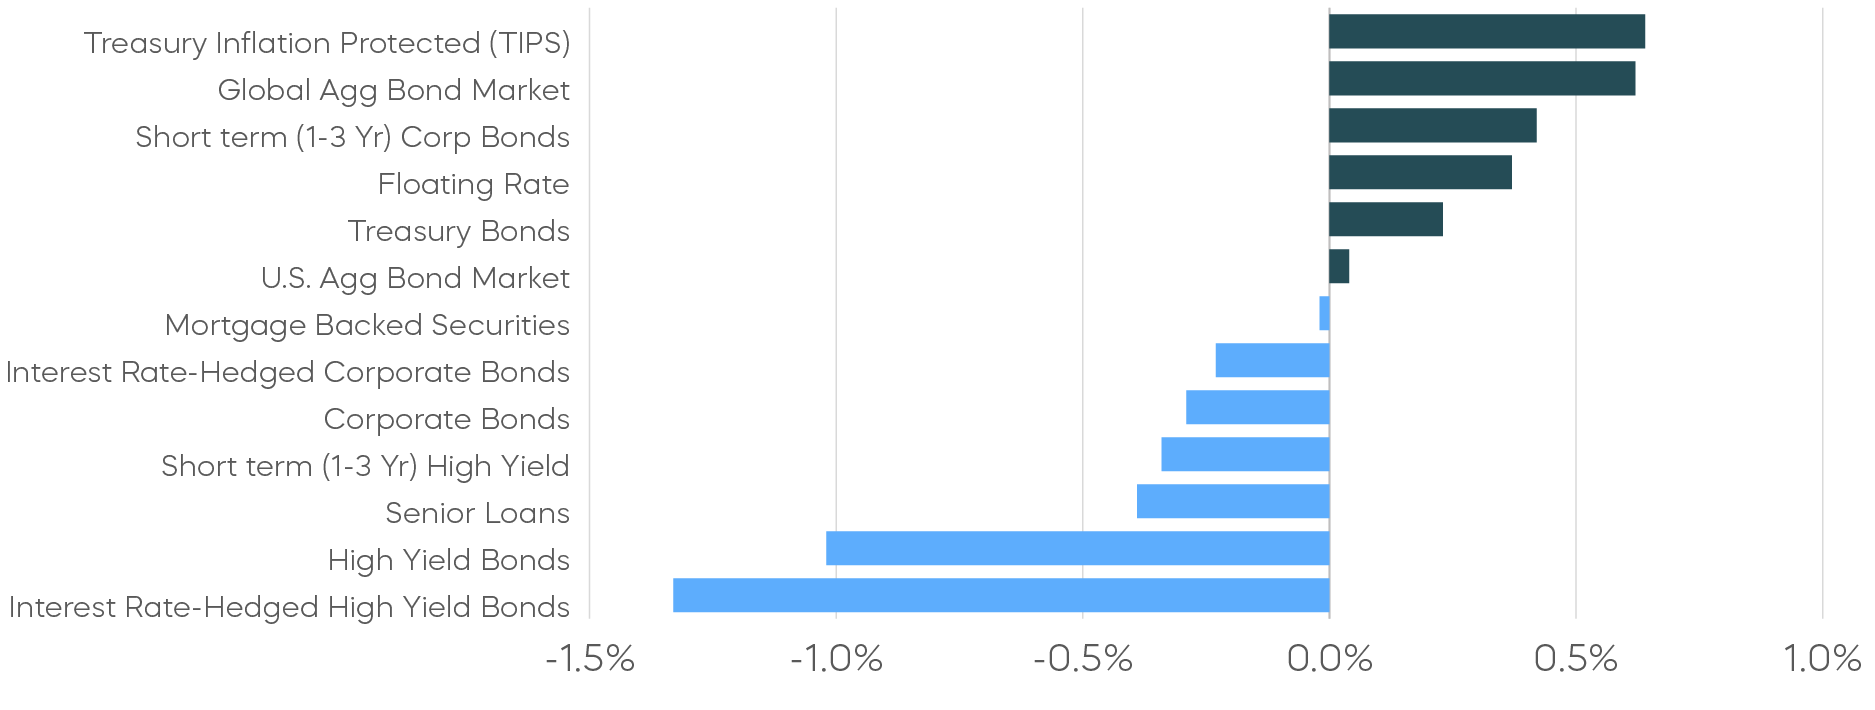
Source: Bloomberg. March returns from 3/1/25–3/31/25. Index returns are for illustrative purposes only and do not reflect any management fees, transaction costs or expenses. Indexes are unmanaged, and one cannot invest directly in an index. Past performance does not guarantee future results.
Supply and Demand Shocks
With reciprocal tariffs roiling markets, investors have been flocking to U.S. Treasury bonds, reinforcing their perceived safe-haven status amid rising uncertainty. Across the Atlantic, however, Germany—on the receiving end of new tariffs—experienced the largest single-day surge in its 10-year Bund (bond) yield since joining the eurozone. What explains this stark example of divergence in bond market reactions?
Global Government Bond Yields Have Moved in Opposite Directions
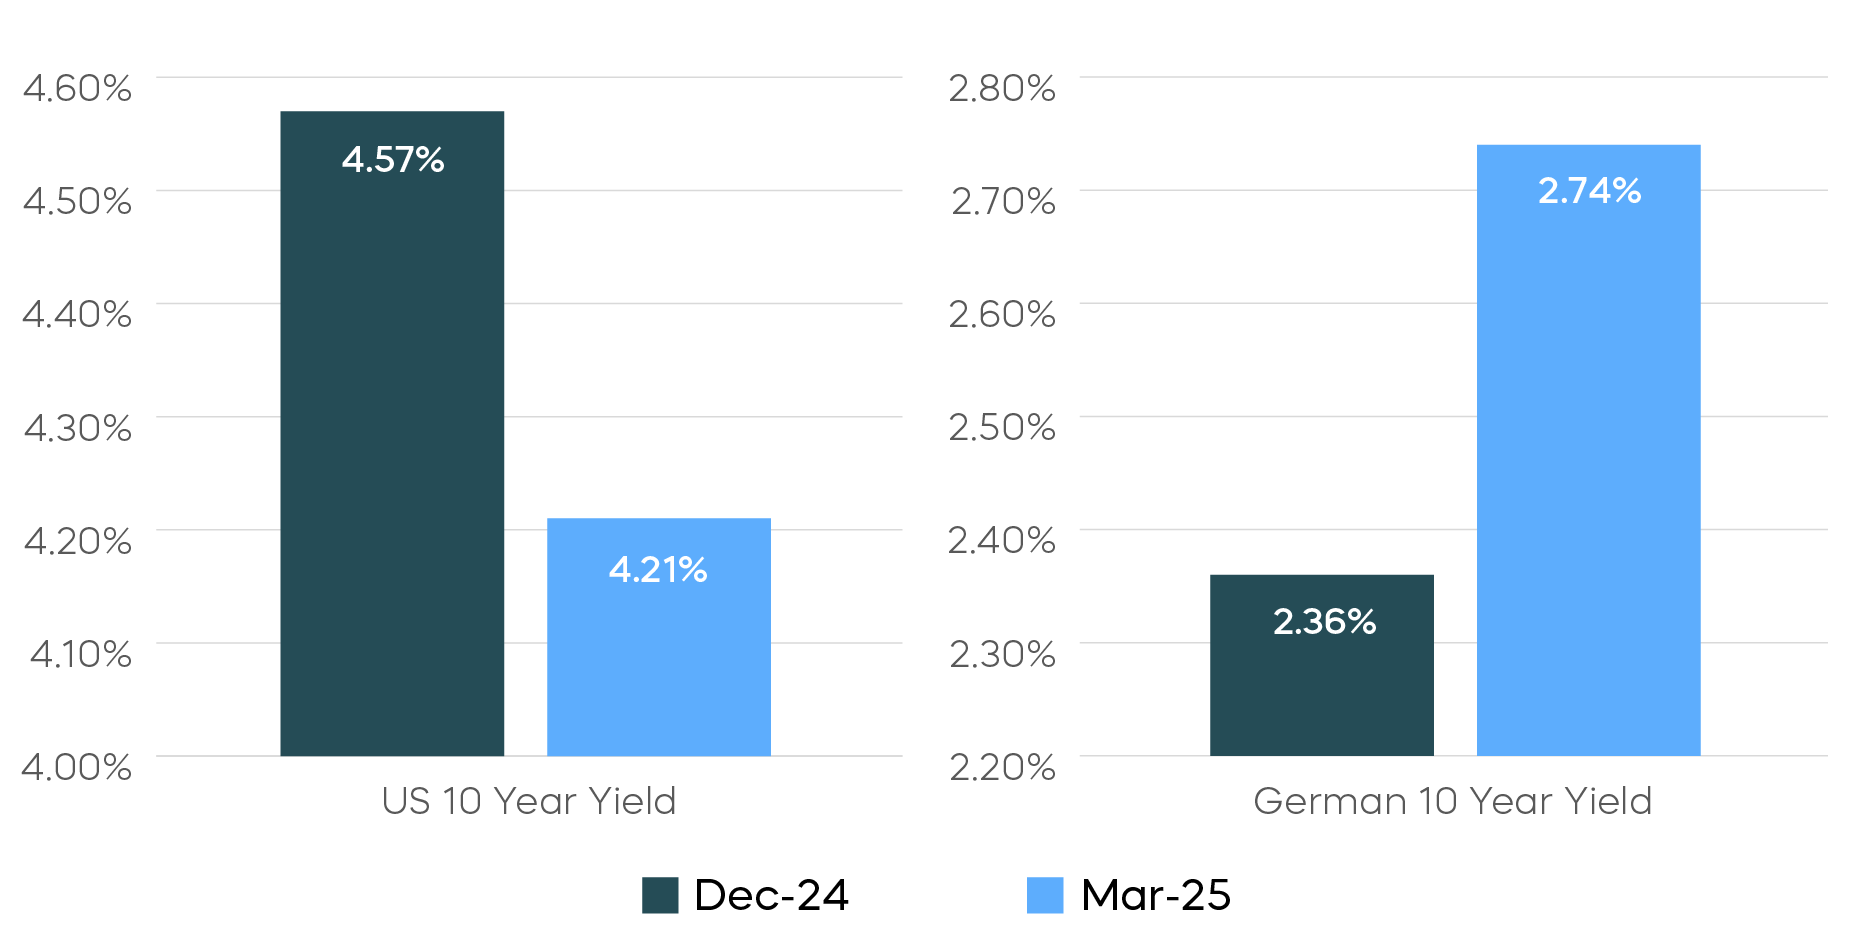
Source: Bloomberg. Data from 12/31/24–3/31/25. Index returns are for illustrative purposes only and do not reflect any management fees, transaction costs or expenses. Indexes are unmanaged, and one cannot invest directly in an index. Past performance does not guarantee future results.
Tariffs can act as a classic supply shock, immediately increasing the cost of foreign goods. U.S. firms typically pass these higher costs onto consumers, fueling short-term inflationary pressures. Conversely, Germany faces a demand shock. Exporters see orders decline, inventories build up, and producers are ultimately forced to lower prices. Thus, tariffs can prove inflationary for importers in the U.S. and deflationary for exporters in Germany.
This divergence extends into fiscal policy. Germany, historically known for fiscal discipline, has significantly relaxed its approach. While primarily motivated by national security concerns, it could also attempt to strategically offset tariff-induced deflation with substantial stimulus spending. The U.S. government, meanwhile, is moving in the opposite direction, tightening fiscal policy by streamlining government operations, cutting spending, and shrinking the federal workforce. This strategy could also aim to dampen tariff-driven inflation.
We also see monetary policy expectations further amplifying the yield divergence. While market projections for ECB rate cuts in 2025 remain stable, expectations of additional easing by the Fed have increased significantly. Markets seem to be anticipating that the Fed will prioritize growth concerns arising from tariff-induced uncertainty over inflation pressures. Changes in anticipated policy rates could account for slightly more than half of the observed divergence in 10-year yields, with the remainder largely attributable to expectations of slower U.S. economic growth.
Recent currency movements, which are closely tied to real yields, seem to further support this view. The U.S. dollar weakened more than 4% against the euro over the first quarter driven by both the narrowing interest rate differential and a shifting relative economic outlook favoring Germany over the U.S.
Rate Cut Expectations Have Shifted in the U.S.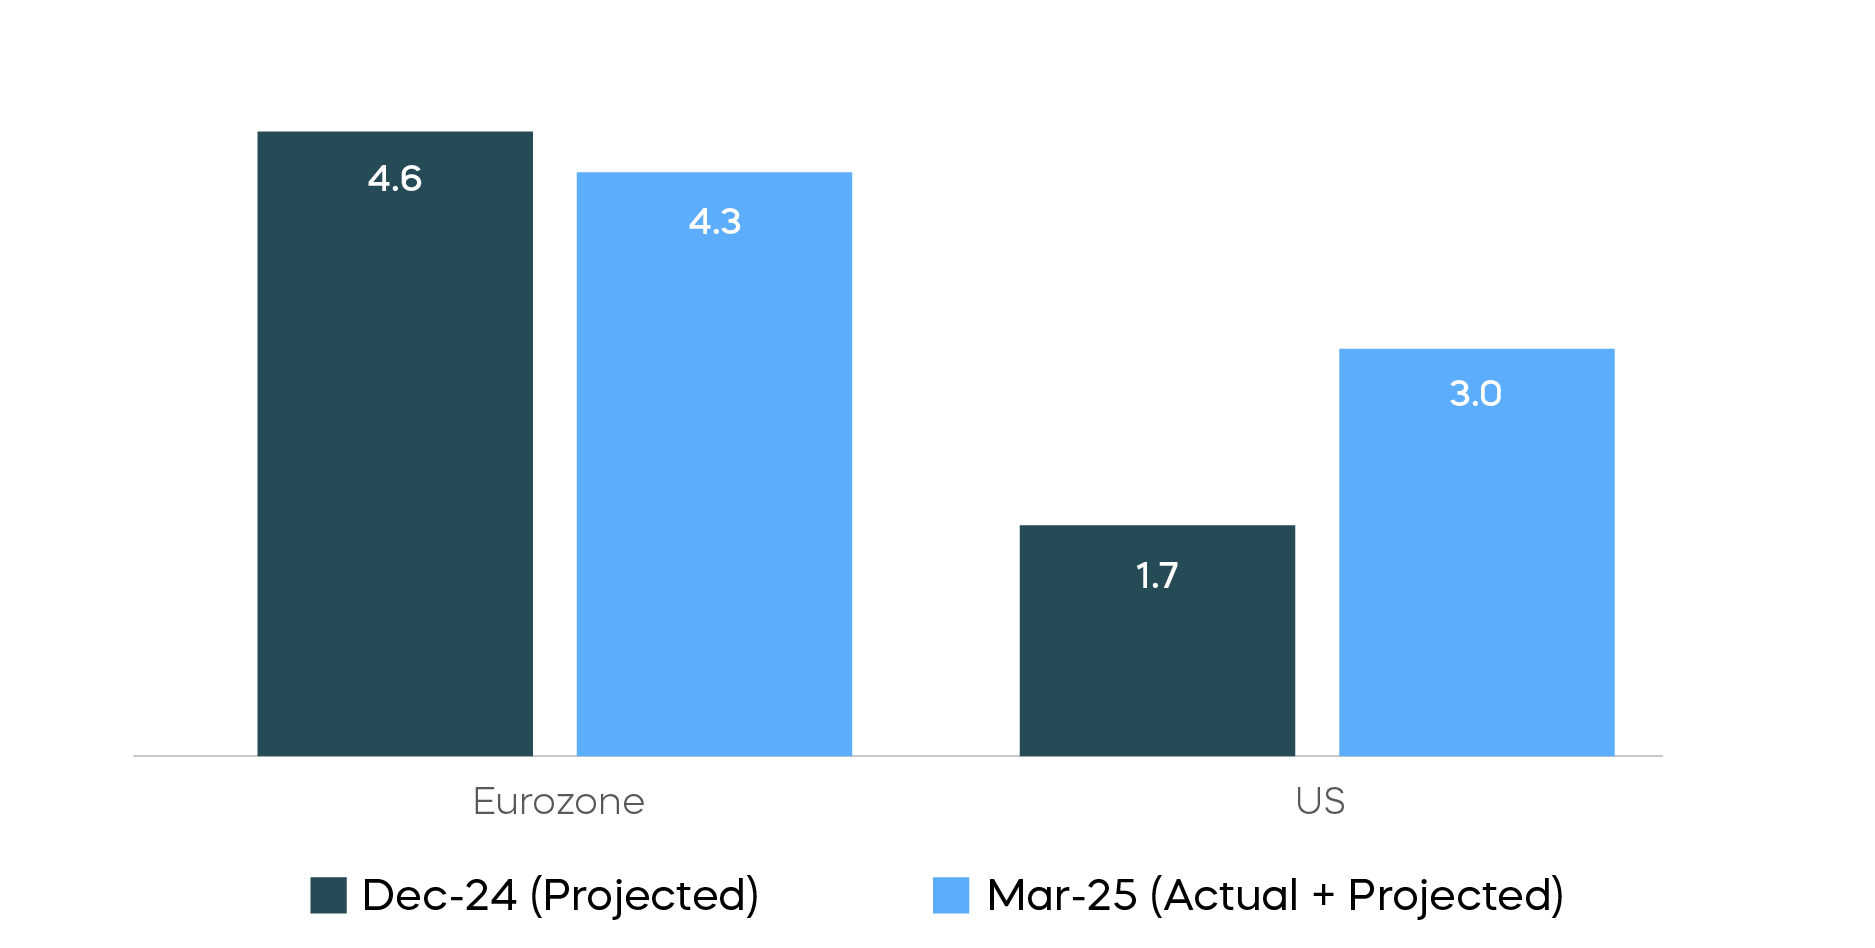
Source: Bloomberg. Data from 12/31/24–3/31/25.
Much of this narrative may be already well reflected in market pricing. The sharp rally in U.S. Treasurys and the surge in Bund yields have effectively priced in a significant amount of the anticipated bad news for the U.S. and the good news for Germany.
This informs positioning for bond investors in several ways. First, while the Fed maintains an easing bias, the uncertain growth-inflation trade-off introduced by tariffs may put further rate cuts on pause in the near term. Second, though the risk of stagflation has risen, U.S. consumers and corporations generally entered this period with strong balance sheets that could cushion broader economic fallout. Third and most importantly, with global bond yields having already adjusted to reflect this asymmetric shock, there is a potential for U.S. yields to back up from current levels if demand for safe-haven assets moderates, or if growth expectations begin to stabilize.
[1]The "price-to-book ratio" compares a firm's market capitalization to its book value, and it can be used to help identify potentially undervalued companies.
[2]“Price-to-Earnings” (P/E) shows how much investors are paying for a dollar of a company's earnings. P/E helps to assess the relative value of a company’s stock by measuring its share price relative to its earnings.
Sources for data and statistics: Bloomberg, FactSet, Morningstar, and ProShares.
The different market segments represented in the performance recap charts use the following indexes: U.S. Large Cap: S&P 500 TR; U.S. Large Cap Growth: S&P 500 Growth TR; U.S. Large Cap Value: S&P 500 Value TR; U.S. Mid Cap: S&P Mid Cap TR; U.S. Small Cap: Russell 2000 TR; International Developed Stocks: MSCI Daily TR NET EAFE; Emerging Markets Stocks: MSCI Daily TR Net Emerging Markets; Global Infrastructure: Dow Jones Brookfield Global Infrastructure Composite; Commodities: Bloomberg Commodity TR; U.S. Bonds: Bloomberg U.S. Aggregate; U.S. High Yield: Bloomberg Corporate High Yield; International Developed Bonds: Bloomberg Global Agg ex-USD; Emerging Market Bonds: DBIQ Emerging Markets USD Liquid Balanced.
The different market segments represented in the fixed income returns charts use the following indexes: Global Agg Bond Market: Bloomberg Global-Aggregate Total Return Index Value Unhedged USD; Mortgage Backed Securities: Bloomberg U.S. MBS Index Total Return Value Unhedged USD; Treasury Bonds: Bloomberg U.S. Treasury Total Return Unhedged USD; U.S. Agg Bond Market: Bloomberg U.S. Agg Total Return Value Unhedged USD; Corporate Bonds: Bloomberg US Corporate Total Return Value Unhedged USD; High Yield Bonds: Bloomberg U.S. Corporate High Yield Total Return Index Value Unhedged USD; Interest Rate-Hedged High Yield Bonds: FTSE High Yield (Treasury Rate-Hedged) Index; Treasury Inflation Protected (TIPS): Bloomberg U.S. Treasury Inflation Notes TR Index Value Unhedged USD; Short term (1-3 Yr) High Yield: Bloomberg U.S. Corporate 0-3 Year Total Return Index Value Unhedged USD; Senior Loans: Morningstar LSTA U.S. Leveraged Loan 100 Index; Short term (1-3 Yr) Corp Bonds: Bloomberg U.S. Corporate 1-3 Yr Total Return Index Value Unhedged USD; Floating Rate: Bloomberg U.S. FRN < 5 yrs Total Return Index Value Unhedged USD; Interest Rate-Hedged Corporate Bonds: FTSE Corporate Investment Grade (Treasury Rate-Hedged) Index.
The S&P 500 is a benchmark index published by Standard & Poor's (S&P) representing 500 companies with large-cap market capitalizations. The S&P 500 Dividend Aristocrats Index targets companies that are currently members of the S&P 500 that have increased dividend payments each year for at least 25 years. The S&P MidCap 400 is a benchmark index published by Standard & Poor's (S&P) representing 400 companies with mid-cap market capitalizations. The S&P MidCap 400 Dividend Aristocrats Index targets companies that are currently members of the S&P MidCap 400 that have increased dividend payments each year for at least 15 years. The S&P 500® Value measures constituents from the S&P 500 that are classified as value stocks based on three factors: the ratios of book value, earnings and sales to price. The S&P 500® Momentum is designed to measure the performance of securities in the S&P 500 universe that exhibit persistence in their relative performance. The S&P 500® Growth measures constituents from the S&P 500 that are classified as growth stocks based on three factors: sales growth, the ratio of earnings change to price, and momentum. The S&P 500® High Beta Index measures the performance of 100 constituents in the S&P 500 that are most sensitive to changes in market returns. The Russell 2000® Index measures the performance of approximately 2,000 small-cap US equities. The Nasdaq-100 Index® represents 100 of the largest non-financial companies listed on the Nasdaq Stock Market selected based on market capitalization. The Dow Jones Industrial Average® (The Dow®), is a price-weighted measure of 30 U.S. blue-chip companies. THESE ENTITIES AND THEIR AFFILIATES MAKE NO WARRANTIES AND BEAR NO LIABILITY WITH RESPECT TO PROSHARES.
This is not intended to be investment advice. Indexes are unmanaged, and one cannot invest directly in an index. Past performance does not guarantee future results.
Any forward-looking statements herein are based on expectations of ProShare Advisors LLC at this time. Whether or not actual results and developments will conform to ProShare Advisors LLC’s expectations and predictions, however, is subject to a number of risks and uncertainties, including general economic, market and business conditions; changes in laws or regulations or other actions made by governmental authorities or regulatory bodies; and other world economic and political developments. ProShare Advisors LLC undertakes no duty to update or revise any forward-looking statements, whether as a result of new information, future events or otherwise.
Investing involves risk, including the possible loss of principal. This information is not meant to be investment advice.
The “S&P 500®,” “S&P MidCap400®,” “S&P 500® Dividend Aristocrats® Index,” “S&P MidCap 400® Dividend Aristocrats® Index,” “S&P® Technology Dividend Aristocrats® Index,” and the “Dow Jones Industrial Average” are products of S&P Dow Jones Indices LLC and its affiliates. "S&P®" is a registered trademark of Standard & Poor’s Financial Services LLC (“S&P”), and “Dow Jones®" is a registered trademark of Dow Jones Trademark Holdings LLC (“Dow Jones”) and they have been licensed for use by S&P Dow Jones Indices LLC and its affiliates. Nasdaq® and the Nasdaq-100 Index® are registered trademarks of Nasdaq, Inc. The “Russell 2000 Index” and “Russell®” are trademarks of the relevant LSE Group companies and are used by any other LSE Group company under license. FTSE Russell is a trading name of certain of the LSE Group companies. All rights in the FTSE Russell indexes or data vest in the relevant LSE Group company which owns the index or the data. Neither LSE Group nor its licensors accept any liability for any errors or omissions in the indexes or data, and no party may rely on any indexes or data contained in this communication. No further distribution of data from the LSE Group is permitted without the relevant LSE Group company’s express written consent. All have been licensed for use by ProShare Advisors LLC. ProShares ETFs based on these indexes are not sponsored, endorsed, sold or promoted by these entities or their affiliates, and they make no representation regarding the advisability of investing in ProShares ETFs. THESE ENTITIES AND THEIR AFFILIATES MAKE NO WARRANTIES AND BEAR NO LIABILITY WITH RESPECT TO PROSHARES.