Key Observations

Did a rotation towards mid-cap and small-cap stocks begin in July? After a decade of large-cap equity dominance and a stunning first half of 2024 mega-cap run, July results suggested the answer was an emphatic ‘yes.’
The S&P MidCap 400 returned 5.8% and the previously moribund Russell 2000 Index returned an impressive 10.2% in July, while the S&P 500 eked out only a 1.2% gain. The previous underperformance of mid- and small-cap stocks has been going on for so long that this one-month turnaround has not even dented valuations, which are still trading at roughly half the price-to-book value of large-cap stocks. With momentum and valuation on the side of mid and small caps, what could go wrong? Let’s look at earnings.
Chart of the Month
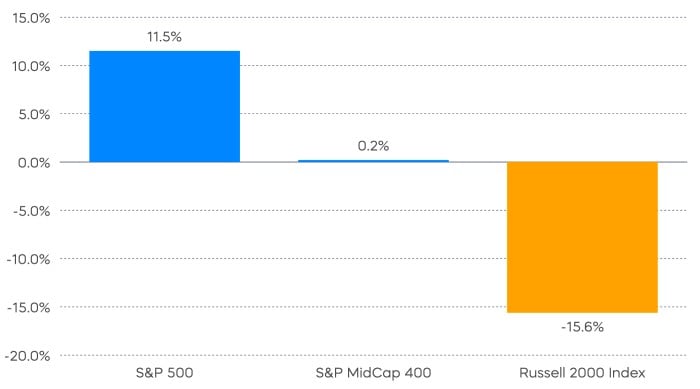
Source: Bloomberg. Data is as of 7/31/2024. Index returns are for illustrative purposes only and do not reflect any management fees, transaction costs or expenses. Indexes are unmanaged, and one cannot invest directly in an index. Past performance does not guarantee future results.
With roughly two-thirds of S&P 500 companies reporting and roughly half of mid- and small-cap companies results in, large caps have delivered strong earnings results. Mid- and small-cap stocks, as the chart implies, not so much. That seems to provide support for those who see continued large/mega-cap strength. Consider this as further support: Back in the late 1990s Clayton Christensen—in his classic “The Innovators Dilemma”—posited that large companies have a strong disincentive to innovate, since new products and services will undermine existing ones. The artificial intelligence (AI) opportunity may be turning this logic on its head.
The sheer magnitude of required investment into AI and the potential for AI-driven opportunities to leverage massive existing client bases has so far positioned large, incumbent companies extremely well for the AI revolution. Still, it’s notable that in 1999 the S&P 500 technology sector generated a powerful 19.6% return on equity (ROE)[1], but that figure was -8.1% in 2001.
For those skeptical of continued large/mega-cap dominance, or who are seeking prudent diversification with mid- and small-cap equities, there is good news. Most mid and small cap stocks seem to be “on sale” from a valuation persepctive—and not just the ones that might deserve to be.
Performance Recap
Small- and mid-cap stocks significantly outperformed their large-cap counterparts in July, closing most of the performance gap year-to-date. Five out of the “Magnificent Seven” stocks posted negative returns during the month, as large-cap stocks suffered their worst single-day performance since late 2022. Nevertheless, large-cap stocks managed to generate a positive return in July.
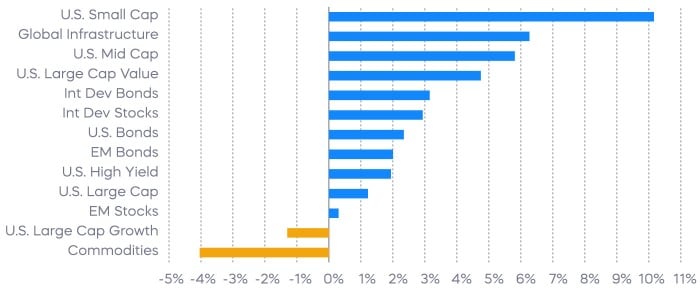
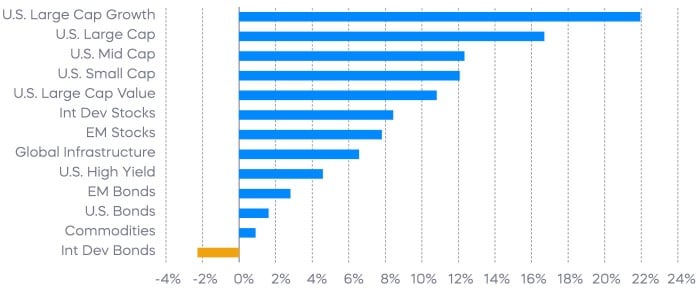
Source: Bloomberg. Year-to-date returns 1/1/24‒7/31/24. Index returns are for illustrative purposes only and do not reflect any management fees, transaction costs or expenses. Indexes are unmanaged, and one cannot invest directly in an index. Past performance does not guarantee future results.
Economic Calendar
Here’s a list of key and upcoming economic releases, which can serve as a guide to potential market indicators.
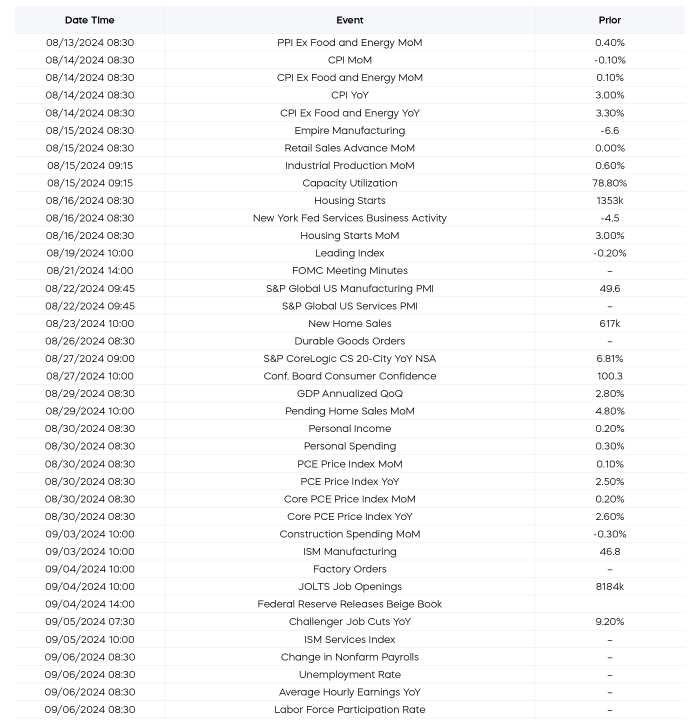
Source: Bloomberg. Data is as of 8/1/24.
Equity Perspectives

Here’s a quick reminder why a potentially sustained period of mid- and small-cap outperformance is worth taking seriously.
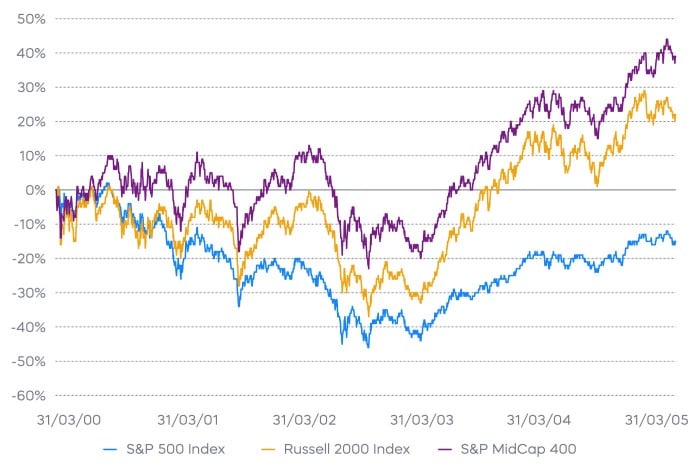
Source: Blomberg. Data is from 3/31/2000–3/31/2005. Index returns are for illustrative purposes only and do not reflect any management fees, transaction costs or expenses. Indexes are unmanaged, and one cannot invest directly in an index. Past performance does not guarantee future results.
The bursting of the tech bubble in 2000 kicked off a sustained period of outperformance for mid- and small-cap stocks. Even for those who see a path for continued large-cap strength today—whether from earnings strength, rate cuts, or a soft landing—the case for having an allocation to mid and small cap stocks in your portfolio seems compelling.
A key challenge to investing in mid- and small-cap stocks is that quality typically degrades as company size decreases. Earnings may be inconsistent or even negative, and leverage increases, leaving investors asking the question “are the stocks cheap enough?” The good news today is that small- and mid-cap stock underperformance has been so substantial for so long that most are on sale—even the minority high-quality cohort. That brings us to mid- and small-cap dividend growth stocks.
The S&P MidCap 400 Dividend Aristocrats Index and the Russell 2000 Dividend Growth Index track mid- and small-cap stocks that have consistently grown their dividends. There are myriad ways to note their quality compared the broad mid- and small-cap universe, but there is a critical differentiator right now.
While the broader S&P MidCap 400 and Russell 2000 are struggling on the earnings front, the S&P MidCap 400 Dividend Aristocrats Index and the Russell 2000 Dividend Growth Index are both generating strong earnings growth. Valuation is on their side as well, with both trading at less than half of the price-to-book (P/B) of large caps, and in an unusual twist of fate, they are cheaper than the S&P MidCap 400 and Russell 2000, respectively.
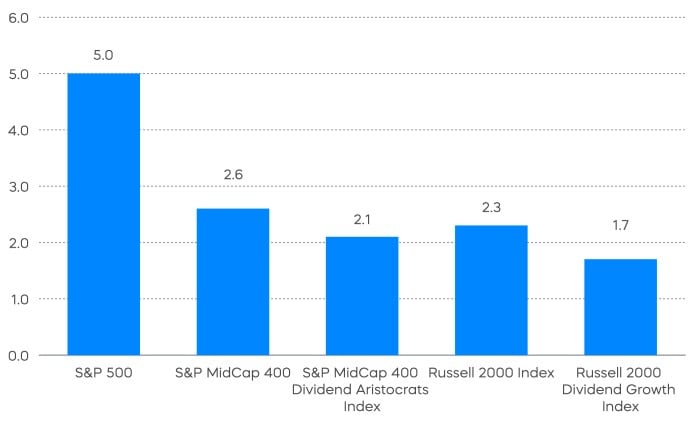
Source: Bloomberg. Data is as of 7/31/24. The "price-to-book ratio" compares a firm's market capitalization to its book value, and it can be used to help identify potentially undervalued companies. Index returns are for illustrative purposes only and do not reflect any management fees, transaction costs or expenses. Indexes are unmanaged, and one cannot invest directly in an index. Past performance does not guarantee future results.

Source: Bloomberg. Data is as of 7/31/24. Index returns are for illustrative purposes only and do not reflect any management fees, transaction costs or expenses. Indexes are unmanaged, and one cannot invest directly in an index. Past performance does not guarantee future results.
The data seems to make a strong case for grabbing mid- and small-cap dividend growth stocks out of the bargain bin, and perhaps leaving the rest behind.
Fixed Income Perspectives

Rates have rallied amid growing anticipation that the Federal Reserve will begin reducing interest rates in September. The short-term interest rate futures market has priced in nearly three rate cuts by the end of the year, and four more rate cuts next year. Credit spreads remained largely unchanged in July, and mortgage-backed securities outperformed Treasurys as the yield curve steepened.
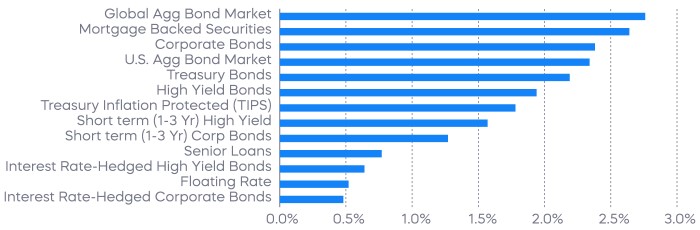
Source: Bloomberg. July returns 7/1/24‒7/31/24. Index returns are for illustrative purposes only and do not reflect any management fees, transaction costs or expenses. Indexes are unmanaged, and one cannot invest directly in an index. Past performance does not guarantee future results.
Preparing for a Longer Credit Cycle
In our June commentary, we highlighted two significant trends in the bond market: the anticipation of rate cuts starting in September, and the challenges posed by historically tight credit spreads. The recent Federal Open Market Committee (FOMC) meeting provided greater clarity on the likelihood of the first rate cut. As inflation continues to cool, the Federal Reserve has strongly signaled that a rate cut is expected in September. The receding inflation concerns could also potentially benefit credit investors by prolonging the current credit expansion.
Tight credit spreads are typically observed during the expansionary phase of a credit cycle, generally reflecting investors’ willingness to accept lower returns because of the reduced risk of corporate defaults. Today’s tight spreads reflect the low leverage among many borrowers at what may still be the early stages of the credit cycle.
Notably, the median leverage ratio for non-financial issuers has stabilized after retreating from post-COVID highs, suggesting that tight spreads could be supported by solid fundamentals, even if default rates may rise slightly from current low levels.
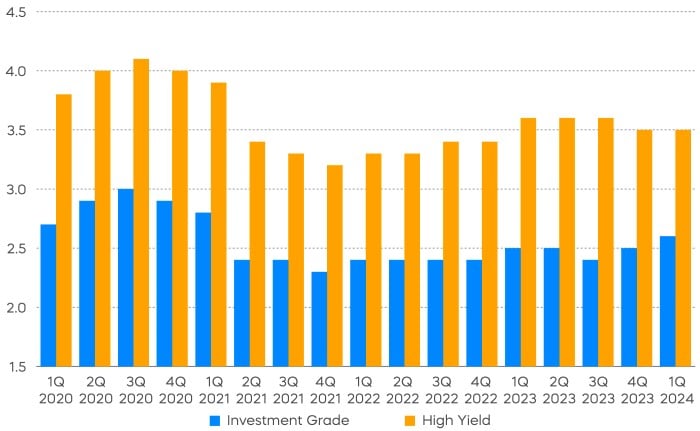
Source: Bloomberg, ProShares calculations. Non-financial issuers as of 7/31/24. TTM net debt to EBITDA for 521 issuers in the Bloomberg U.S. Agg Corporate Index and 283 issuers in the Bloomberg US Corporate HY Index. EBITDA (earnings before interest, taxes, depreciation, and amortization) is a measure of core corporate profitability calculated by adding interest, tax, depreciation, and amortization expenses to net income.
it is also noteworthy to consider how corporate borrowers have managed to navigate the sharp interest rate increases over recent years. While certain segments of the debt market have been adversely affected, many financially sound companies have emerged from this period with stronger cash positions than before the rate hikes. For example, non-financial companies in the S&P 500 collectively generated over $170 billion in net interest income in the latest fiscal year, potentially positioning them well for future business investments.[2]
For a credit cycle to transition into a downturn, we typically see a tightening of lending standards amid an economic slowdown. However, as the Fed pauses rate hikes, fewer banks report tightening lending standards on commercial and industrial loans, paving the way for continued credit expansion with impending rate cuts.
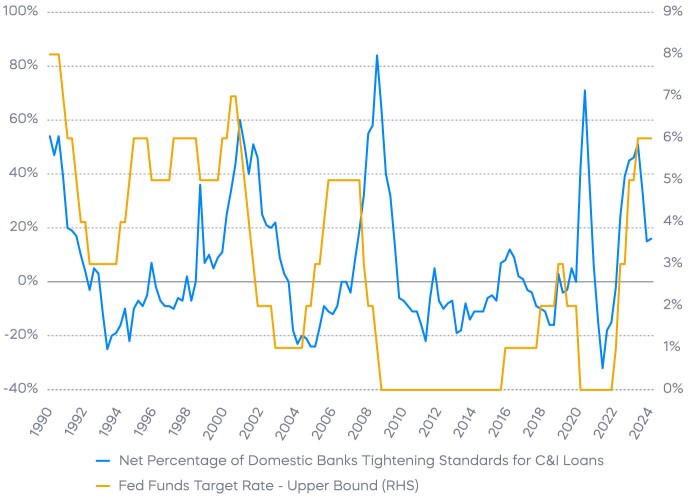
Source: Bloomberg. Quarterly data ending in April 2024. Federal Reserve, Senior Loan Officer Opinion Survey on Bank Lending Practices.
A year ago, we anticipated the potential for a "goldilocks environment for simply earning yield" as the economy exceeded expectations. Since then, credit spreads have continued to tighten, further limiting opportunities for price appreciation. Nevertheless, we believe the current environment remains an expansionary phase of the credit cycle. Investors who can be selective in lower-rated credits, while reducing spread duration in higher-rated credits, may continue to find fixed-income returns in the form of yield.
The different market segments represented in the performance recap charts use the following indexes: U.S. Large Cap: S&P 500 TR; U.S. Large Cap Growth: S&P 500 Growth TR; U.S. Large Cap Value: S&P 500 Value TR; U.S. Mid Cap: S&P Mid Cap TR; U.S. Small Cap: Russell 2000 TR; International Developed Stocks: MSCI Daily TR NET EAFE; Emerging Markets Stocks: MSCI Daily TR Net Emerging Markets; Global Infrastructure: Dow Jones Brookfield Global Infrastructure Composite; Commodities: Bloomberg Commodity TR; U.S. Bonds: Bloomberg U.S. Aggregate; U.S. High Yield: Bloomberg Corporate High Yield; International Developed Bonds: Bloomberg Global Agg ex-USD; Emerging Market Bonds: DBIQ Emerging Markets USD Liquid Balanced.
The different market segments represented in the fixed income returns charts use the following indexes: Global Agg Bond Market: Bloomberg Global-Aggregate Total Return Index Value Unhedged USD; Mortgage Backed Securities: Bloomberg U.S. MBS Index Total Return Value Unhedged USD; Treasury Bonds: Bloomberg U.S. Treasury Total Return Unhedged USD; U.S. Agg Bond Market: Bloomberg U.S. Agg Total Return Value Unhedged USD; Corporate Bonds: Bloomberg US Corporate Total Return Value Unhedged USD; High Yield Bonds: Bloomberg U.S. Corporate High Yield Total Return Index Value Unhedged USD; Interest Rate-Hedged High Yield Bonds: FTSE High Yield (Treasury Rate-Hedged) Index; Treasury Inflation Protected (TIPS): Bloomberg U.S. Treasury Inflation Notes TR Index Value Unhedged USD; Short term (1-3 Yr) High Yield: Bloomberg U.S. Corporate 0-3 Year Total Return Index Value Unhedged USD; Senior Loans: Morningstar LSTA U.S. Leveraged Loan 100 Index; Short term (1-3 Yr) Corp Bonds: Bloomberg U.S. Corporate 1-3 Yr Total Return Index Value Unhedged USD; Floating Rate: Bloomberg U.S. FRN < 5 yrs Total Return Index Value Unhedged USD; Interest Rate-Hedged Corporate Bonds: FTSE Corporate Investment Grade (Treasury Rate-Hedged) Index.
The S&P 500 is a benchmark index published by Standard & Poor's (S&P) representing 500 companies with large-cap market capitalizations. The S&P MidCap 400 is a benchmark index published by Standard & Poor's (S&P) representing 400 companies with mid-cap market capitalizations. The Russell 2000 Index is a small-cap U.S. stock market index that makes up the smallest 2,000 stocks in the Russell Index. The S&P 500 Dividend Aristocrats Index targets companies that are currently members of the S&P 500 that have increased dividend payments each year for at least 25 years. The S&P MidCap 400 Dividend Aristocrats Index targets companies that are currently members of the S&P MidCap 400 that have increased dividend payments each year for at least 15 years. The Russell 2000 Dividend Growth Index targets companies that are currently members of the Russell 2000 that have increased dividend payments each year for at least 10 years. THESE ENTITIES AND THEIR AFFILIATES MAKE NO WARRANTIES AND BEAR NO LIABILITY WITH RESPECT TO PROSHARES.
This is not intended to be investment advice. Indexes are unmanaged, and one cannot invest directly in an index. Past performance does not guarantee future results.
Any forward-looking statements herein are based on expectations of ProShare Advisors LLC at this time. Whether or not actual results and developments will conform to ProShare Advisors LLC’s expectations and predictions, however, is subject to a number of risks and uncertainties, including general economic, market and business conditions; changes in laws or regulations or other actions made by governmental authorities or regulatory bodies; and other world economic and political developments. ProShare Advisors LLC undertakes no duty to update or revise any forward-looking statements, whether as a result of new information, future events or otherwise.
Investing involves risk, including the possible loss of principal. This information is not meant to be investment advice.
The “S&P 500®,” “S&P MidCap 400®,” “S&P 500® Dividend Aristocrats® Index” and “S&P MidCap 400® Dividend Aristocrats® Index” are products of S&P Dow Jones Indices LLC and its affiliates and have been licensed for use by ProShare Advisors LLC. "S&P®" is a registered trademark of Standard & Poor’s Financial Services LLC (“S&P”), and “Dow Jones®" is a registered trademark of Dow Jones Trademark Holdings LLC (“Dow Jones”) and they have been licensed for use by S&P Dow Jones Indices LLC and its affiliates. The "Russell 2000® Dividend Growth Index" and "Russell®" are trademarks of Russell Investment Group ("Russell") and have been licensed for use by ProShares. ProShares ETFs based on these indexes are not sponsored, endorsed, sold or promoted by these entities or their affiliates, and they make no representation regarding the advisability of investing in ProShares ETFs. THESE ENTITIES AND THEIR AFFILIATES MAKE NO WARRANTIES AND BEAR NO LIABILITY WITH RESPECT TO PROSHARES.