Key Observations

Even with a strong equity market, declining inflation, solid earnings, and a “soft landing” looking likely, there are reasons for caution in the second half of 2024—and perhaps a return to sound fundamentals like asset allocation.
What has the first half of 2024 looked like so far?
- The S&P 500 gained over 15%.
- Inflation receded while unemployment held low and steady.
- Corporate earnings growth was healthy, with S&P 500 earnings growing 8% year-over-year in the first quarter.
- The 10-Year Treasury yield has been range-bound near its long-term average.
The soft or “no” landing seems well in hand. Still, with just three stocks accounting for 20% of the value of the S&P 500, and the Nasdaq-100 trading at a price-to-earnings (P/E) ratio of 32[1], even those who are comfortable with the path of the economy may not be quite as comfortable with the setup of the stock market. Faced with such conditions, investors might be wise to return their attention to a perhaps neglected but core approach to uncertainty: asset allocation.
Skepticism or even outright antagonism towards this bedrock investment principle—a diversified asset allocation—has a logical source: performance.
Cumulative Total Asset Class Returns, June 2019–June 2024
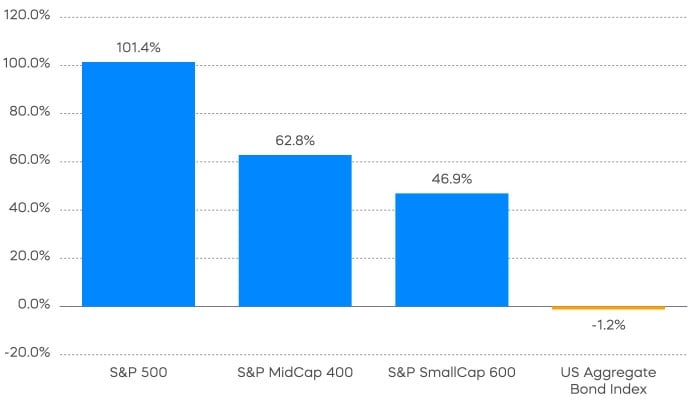
Over the last five years, small-cap and mid-cap stocks have delivered about half the return of large-caps. And the Bloomberg U.S. Aggregate Bond Index has lost money. Diversified asset allocation strategies seem to have been punished.
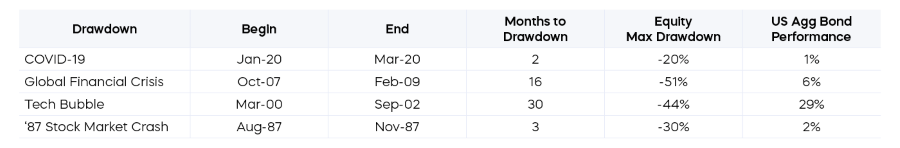
Let’s broaden the lens for a minute, however, beginning with equities. The recent underperformance of mid-cap and small-cap stocks has not tarnished their long-term performance. Take a look at the 30-year period, including the bursting of the dot-com bubble, or “tech wreck.”

Many investors may have forgotten that the so called “tech wreck,” which hit large cap stocks much harder than mid-caps and small caps, also kicked off a protracted period of underperformance for large-caps. Even ten years later, mid-cap and small-cap stocks were comfortably in the green, while large-caps had not yet fully recovered their losses.
Today, mid-cap and small-cap stocks are generally trading at discounts to large-cap stocks that are in a similar ballpark to just before the tech wreck. With these conditions, it would seem prudent to remember that both a long-term asset allocation perspective and current valuation signals suggest that investors should not forget about mid-cap and small cap stocks.
Now let’s look at the long-term story on bonds. When yields go down, prices rise, and vice versa. The great bull market in bonds began in 1981 with 10-Year Treasury yields peaking at just under 16%. Nearly 40 years later, at the outset of COVID, the 10-Year Treasury yield bottomed at just over 50 basis points. Between the inception of the Bloomberg U.S. Aggregate Bond Index (the "Agg") in 1986 and the bottom of 10-Year Treasury yield in 2020, the Agg delivered an annualized return of 6.5%.
Things became problematic once bond yields got below 1%: they had nowhere to go but up. While much of that decline in bond yields was driven by the successful vanquishing of inflation, part of it was driven by the Federal Reserve’s suppression of long-term yields through Quantitative Easing.
With bond math and the Fed standing in the way, it’s quite understandable for investors to have avoided allocating to bonds for much of the last five years. High short term interest rates have brought some investors back to short-term bonds, but many still avoid “regular” duration fixed income with “regular” interest rate sensitivity. History, however, shows that regular bonds, like those tracked in the Agg, have done their job: yields falling and prices rising when stocks have faltered.
The duration of the Agg is generally around six. Duration is a measure of interest rate sensitivity. The lower the duration, the less sensitive a security or index is to changes in interest rates. Let’s consider a hypothetical scenario. If the economy has a surprisingly hard landing and enters a recession, stocks will likely fall, but so probably will interest rates. A plausible landing spot for the 10-Year Treasury yield might be around 3%. That’s 1.5% lower than today. To approximate the price change for the 10-Year Treasury, one would multiply the 1.5% decline in interest rates by the Agg’s duration of six. That means the price of the Agg could potentially rise by around 9%. For the first time in years, bonds appear to be “at their post” and have the potential to offset market declines as part of a diversified asset allocation.
Considerations for the Second Half of 2024
With bonds no longer appearing to be broken, it is an investment imperative to have the stock allocations in one’s portfolio behave like stocks. That rule has understandably been broken by many investors over the last several years. Since bonds were until recently nearly incapable of offsetting stock market downturns, investors turned to a variety of “defensive” equity strategies.
Covered calls are one such strategy that has grown in investor assets of late. The investor can receive income from selling calls, but may sacrifice total return potential by capping the upside. Far from behaving like equities, traditional monthly covered call strategies have delivered just a fraction of long-term equity market returns.
Traditional Covered Call Strategies Have Limited Long-Term Equity Returns
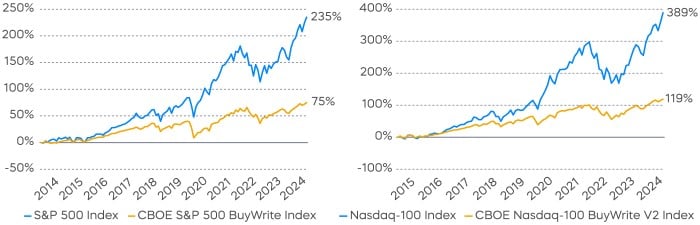
Source: Blomberg. Left chart: Monthly returns from 6/2014–6/2024. Right Chart: Monthly returns from 6/2015–6/2024. Index returns are for illustrative purposes only and do not reflect any management fees, transaction costs or expenses. Indexes are unmanaged, and one cannot invest directly in an index. Past performance does not guarantee future results.
Performance Recap

Equity Perspectives

We entered 2024 with a view that it wasn’t going to be about the Fed. For equity markets, this meant returns weren’t necessarily predicated on easier monetary policy and rate cuts. Rather, for stocks to continue their advance from a narrow 2023 rally, the market would likely need a resilient economic backdrop and earnings to improve. With any luck, this could have enabled broader market participation.
At the halfway point of 2024, the Fed has remained on the sidelines, yet the S&P 500 returned 15%. Even better, those returns were delivered with low volatility driven by exceptionally low correlation readings between individual stocks. Indeed, the economy appears to be on solid footing and first quarter profit growth was encouraging with more expected in the second half of the year.
This goldilocks backdrop has been pleasant, if somewhat unfulfilling, as the market’s narrowness has only intensified. Shockingly few stocks are actually carrying the market’s return, and valuations for market cap weighted strategies like the S&P 500 are in the top decile historically. Large portions of the market appear to be stuck in the mud.
We believe that the playbook for the second half of the year should be to remain vigilant.
- Opportunities for income and capital appreciation exist, but should be chosen wisely.
- Risks to the downside remain present, if perhaps mispriced. Any weakening of economic data could potentially undercut earnings expectations, which may not be enough to support today’s lofty valuations in the first place.
- Volatility could move higher in short order as we enter election season.
Plenty of questions remain, as they always do. In our opinion, it doesn’t seem prudent to chase the AI rally that may already be long in the tooth. Income focused investors don’t need to sacrifice total return potential to generate attractive yield either. Total return investors should consider higher-quality strategies that may play a chameleon-like role of both participating in up markets and being able to withstand market turbulence.
Allocating to Maximize Income and Total Returns in the Second Half
Income focused investors often face tradeoffs in their pursuit of yield and total returns. Bonds, as we’ve talked about, are finally producing decent yields once again. But total returns have been challenged thus far in 2024 amid ongoing rate volatility.
This dynamic has pushed many investors to equity-income categories like Real Estate Investment Trusts (REITs), high dividend yielding stocks, closed-end funds, and master limited partnerships (MLPs), where annualized yield opportunities of 4% and greater are on offer.
The total return opportunity is decidedly more of a mixed bag. REITs and high dividend yielding stocks continue to languish in the post-pandemic growth-dominated market. Closed-end funds and MLPs have delivered better year-to-date returns but have significantly lagged the S&P 500 over longer time periods. Further questions over aspects like leverage and discount levels and income stability further cloud the picture.
Equity-based call writing strategies have emerged as a tool for investors seeking both income and total return opportunities. As discussed in the front section, however, that income has come at a significant cost from a total return perspective.
Since its inception, the CBOE S&P 500 BuyWrite Index—a proxy for traditional covered call strategies utilizing monthly expiring options—has delivered barely half of the returns of the S&P 500. It has been a similar story in 2024, as the traditional covered call index has delivered returns of 7.6% vs. 15.3% of the S&P 500, year-to-date through June.
A daily covered call strategy like the S&P 500 Daily Covered Call Index is capable of improving on that tradeoff, potentially delivering both attractive income and total return opportunities. As of June, the S&P 500 Daily Covered Call Index has delivered most of the returns of the S&P 500, while producing more attractive annualized income levels compared to other equity income options.
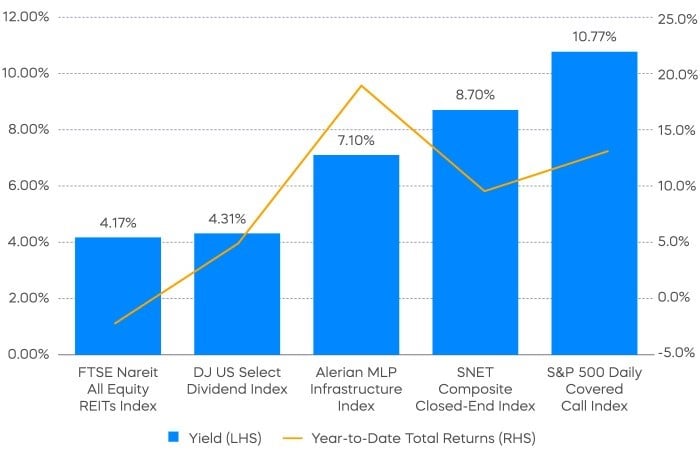
Source: Morningstar, and Standard & Poor’s for returns, data from 1/1/24–6/30/24. Yield information obtained from index fact sheets dated as of 6/30/24. Index returns are for illustrative purposes only and do not reflect any management fees, transaction costs or expenses. Indexes are unmanaged, and one cannot invest directly in an index. Past performance does not guarantee future results.
According to FactSet, analysts expect the S&P 500 to deliver earnings growth of 11.3% in 2024 and 14.4% in 2025. Coming off a lackluster 2023 with essentially no profits growth, such results would be welcome support for equity prices. First quarter earnings growth of 5.9% was a great start, helping support market prices even without Fed interest rate cuts.
The key question, in our view, is will it be enough to support elevated valuations. After all, the price-to-sales ratio for the tech sector—the market’s current growth engine—has never been higher and stands at 9.5x as of June. Any macro narrative that challenges this rosy outlook could easily trigger downside. It’s not unreasonable to imagine a scenario where valuations normalize, even with healthy profits growth.
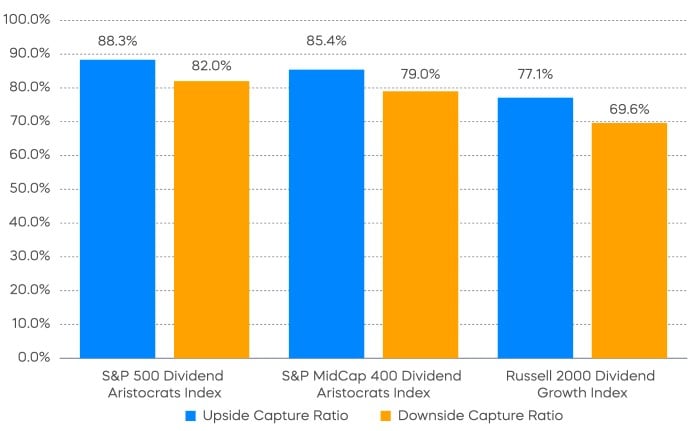
If earnings growth is expected to be the primary driver of equity returns over the near-term, we believe investors should focus on strategies most likely to deliver it. Even better if that profits growth can be purchased at reasonable levels. Higher quality stocks across the market cap spectrum with long records of consistent dividend growth, like the Dividend Aristocrats, seem to fit that description. Dividend Aristocrats strategies have historically delivered more consistent earnings levels, and they are currently trading at attractive valuations relative to the S&P 500. Over time, their consistency has helped deliver all-weather performance, regardless of market uncertainty.
Fixed Income Perspectives

In January, we titled our 2024 Outlook “It’s Not About the Fed” to emphasize that corporate profits, the inflation trajectory, and even long-term interest rates are not as influenced by Federal Reserve policy as many might expect. While we maintain this view, it’s clear that central banks play a critical role in shaping today’s interest rate environment. Consequently, a key input to our fixed income outlook for the second half of 2024 begins with the stance on monetary policy.
We would characterize the Fed today as being highly mindful of “two-sided risk.” Fed Chairman Powell recently discussed the Fed’s cautious approach at a central banking forum, highlighting the delicate balance between avoiding premature interest rate cuts that could undo progress in reducing inflation, and the risk of undermining economic recovery by delaying cuts.
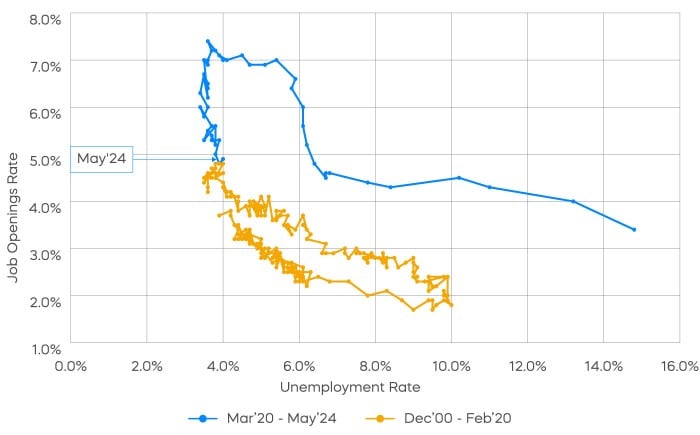
One way to put this two-sided risk into context is by examining the labor market. On one hand, the Fed aims to promote maximum employment as part of its dual mandate. On the other hand, wage growth continues to fuel service inflation, which remains the stickiest part of today’s inflation. The Beveridge Curve in the chart that follows attempts to capture the current state of the labor market through the interplay between unemployment and job openings. Historically, a lower job openings rate has corresponded with a higher employment rate, as indicated by the relationship displayed between them from 2000 through 2020.
From the beginning of the pandemic period in 2020 and into 2024, we have seen unemployment spike to 15%, followed by a decline to below 4%, and a surge in job openings to over 7%. That unusually tight labor market allowed the Fed to hike interest rates aggressively. Since March 2022, interest rate hikes have brought down job openings without the typical increase in unemployment rate. Now that the level of job openings and unemployment have returned to a more balanced level, however, further cooling in the labor market could lead to rising unemployment, reflecting the two-sided risk the Fed is attempting to navigate.
We generally agree with the Fed’s assessment that risks are becoming more balanced. Through the current rate hike cycle, monetary tightening has affected different areas of the economy disproportionately. For example, real estate, regional banks, and low-income households are experiencing significant stress due to the higher cost of borrowing. If inflation continues its downward trend, we would not rule out a September interest rate cut, despite its proximity to the November election.
Stocks and bonds have moved together during the first half of 2024, while the two-year correlation between Treasury bond returns and stock returns remains near the highest level since the 1990s. As inflation began to recede, we proposed that bonds might resume their role as a hedge. However, re-acceleration in service inflation during the first quarter pushed back the market’s timing of interest rate cuts.
The inflation concerns justifiably supported the positive correlation between stocks and bonds. Over the past 50 years, bonds have moved together with stocks both during periods of high growth and low growth when Core PCE Inflation (the Fed’s preferred measure of inflation) is above the median level of 2.3%.
Despite the bumpy road in the first quarter, the last two months of inflation data indicate that core inflation remains on track toward the target. In May, core services excluding housing saw a month-over-month deflation for the first time since 2021. Historically, when Core PCE Inflation is below the long-term median, bonds have consistently acted as a hedge against stocks. As the Federal Reserve approaches cutting interest rates, the ability of bonds to diversify risk should be further restored.

We’ve argued for some time now that we are in a more normalized interest rate environment, and that long-term interest rates should be priced appropriately higher. As we approach the first rate cut of this cycle, it’s crucial to note that this would not be a recessionary cut.
Typically, in a rate cut cycle, the Fed will reduce interest rates sharply in response to an economic downturn. Instead, resilient consumption and capital expenditures are likely to sustain moderate economic growth in the near term. Therefore, any reductions in interest rates are likely to be more measured and gradual.
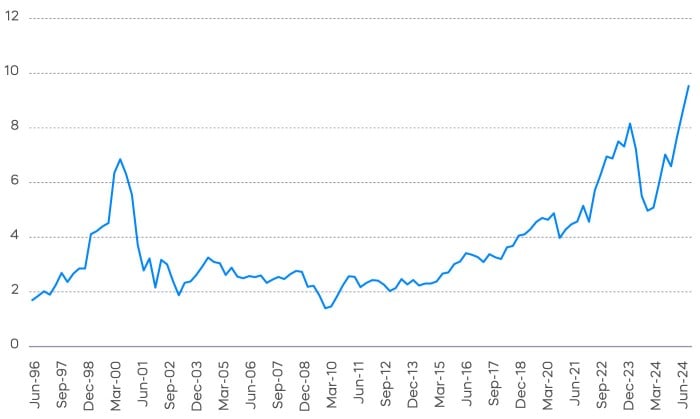
At the same time, forces that lifted long-term interest rates higher for longer remain in place. A year ago, we highlighted the relationship between term premium and interest rate volatility, noting that historically, higher interest rate volatility has been associated with a higher term premium, leading to elevated long-term interest rates. Although this gap has narrowed, the NY Fed's measure of term premium still shows a negative one (-1) standard deviation, indicating potential for further increases in long-term rates.
If we use a simplistic approach to separate the 10-Year Treasury yield into inflation, real short-term rates, and yield curve spread, we see that the yield curve has historically been upward-sloping. Even if inflation and real interest rates recede during the rate cut cycle, the yield curve could steepen from its current inverted state, maintaining higher long-term interest rates. Therefore, while we anticipate the Federal Reserve moving closer to cutting short-term rates, we also expect long-term rates to remain higher for longer.

How does all of this impact asset allocation? As bonds become more effective for diversification, the 60/40 portfolio may once again prove its merits. However, we suggest that investors consider a barbell strategy when allocating the fixed income portion of their portfolio. This approach involves investing in both the front end and the long end of the yield curve, rather than adopting a total market approach.
Given the inverted shape of the yield curve, investing in the front end could enable investors to take advantage of high short-term rates. Meanwhile, the long end may provide diversification benefits in the event of an economic slowdown. Overall, we think investors may wish to consider underweighting the benchmark duration. It is typically counterproductive for fixed income investors to benchmark their duration against the overall market, as most bond market indexes expose investors to excessive interest rate risks, simply as a result of more long-dated borrowing.
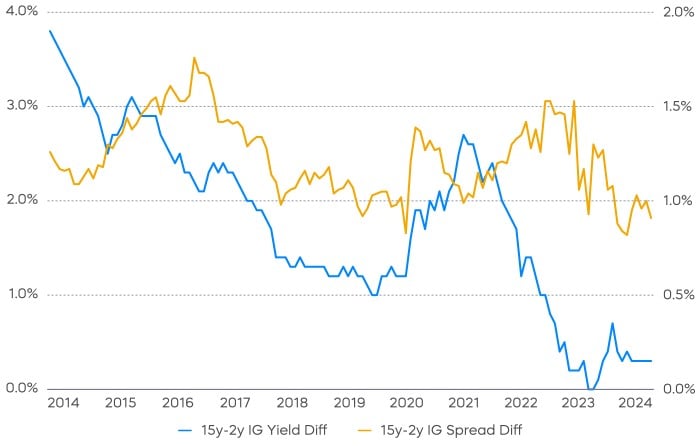
A challenge in asset allocation right now is that most credit spreads are near their all-time tights. Many companies have locked in fixed-rate borrowing or reduced their debt, leading to tight credit spreads reflective of low leverage today. For lower-rated credits, where spreads have some room for further tightening, limiting default risk could be a key consideration. For higher-rated credits with already tight spreads, we see more potential value in the front end of the yield curve. For investment grade bonds, for example, the yield pickup from investing in longer maturity bonds is near the lowest level in the past decade in terms of both credit spreads and all-in yields. When allocating fixed income in today’s environment, investors may wish to focus on the diversification role of bonds and utilizing alternative income-generating strategies to reach the desired yield.
Performance Recap
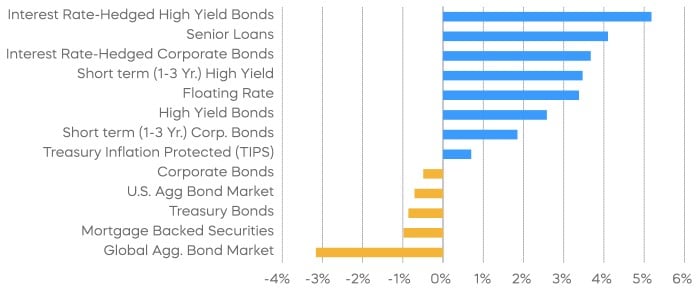
Source: Bloomberg. Year-to-date returns 1/1/24‒6/30/24. Index returns are for illustrative purposes only and do not reflect any management fees, transaction costs or expenses. Indexes are unmanaged, and one cannot invest directly in an index. Past performance does not guarantee future results.
The different market segments represented in the performance recap charts use the following indexes: U.S. Large Cap: S&P 500 TR; U.S. Large Cap Growth: S&P 500 Growth TR; U.S. Large Cap Value: S&P 500 Value TR; U.S. Mid Cap: S&P Mid Cap TR; U.S. Small Cap: Russell 2000 TR; International Developed Stocks: MSCI Daily TR NET EAFE; Emerging Markets Stocks: MSCI Daily TR Net Emerging Markets; Global Infrastructure: Dow Jones Brookfield Global Infrastructure Composite; Commodities: Bloomberg Commodity TR; U.S. Bonds: Bloomberg U.S. Aggregate; U.S. High Yield: Bloomberg Corporate High Yield; International Developed Bonds: Bloomberg Global Agg ex-USD; Emerging Market Bonds: DBIQ Emerging Markets USD Liquid Balanced.
The different market segments represented in the fixed income returns charts use the following indexes: Global Agg Bond Market: Bloomberg Global-Aggregate Total Return Index Value Unhedged USD; Mortgage Backed Securities: Bloomberg U.S. MBS Index Total Return Value Unhedged USD; Treasury Bonds: Bloomberg U.S. Treasury Total Return Unhedged USD; U.S. Agg Bond Market: Bloomberg U.S. Agg Total Return Value Unhedged USD; Corporate Bonds: Bloomberg US Corporate Total Return Value Unhedged USD; High Yield Bonds: Bloomberg U.S. Corporate High Yield Total Return Index Value Unhedged USD; Interest Rate-Hedged High Yield Bonds: FTSE High Yield (Treasury Rate-Hedged) Index; Treasury Inflation Protected (TIPS): Bloomberg U.S. Treasury Inflation Notes TR Index Value Unhedged USD; Short term (1-3 Yr) High Yield: Bloomberg U.S. Corporate 0-3 Year Total Return Index Value Unhedged USD; Senior Loans: Morningstar LSTA U.S. Leveraged Loan 100 Index; Short term (1-3 Yr) Corp Bonds: Bloomberg U.S. Corporate 1-3 Yr Total Return Index Value Unhedged USD; Floating Rate: Bloomberg U.S. FRN < 5 yrs Total Return Index Value Unhedged USD; Interest Rate-Hedged Corporate Bonds: FTSE Corporate Investment Grade (Treasury Rate-Hedged) Index.
The S&P 500 is a benchmark index published by Standard & Poor's (S&P) representing 500 companies with large-cap market capitalizations. The S&P MidCap 400 is a benchmark index published by Standard & Poor's (S&P) representing 400 companies with mid-cap market capitalizations. The S&P SmallCap 600 is a benchmark index published by Standard & Poor's (S&P) representing 600 companies with small-cap market capitalizations. The S&P 500 Dividend Aristocrats Index targets companies that are currently members of the S&P 500 that have increased dividend payments each year for at least 25 years. The S&P MidCap 400 Dividend Aristocrats Index targets companies that are currently members of the S&P MidCap 400 that have increased dividend payments each year for at least 15 years. The S&P 500 Information Technology Index is a benchmark index published by Standard & Poor's (S&P) representing companies included in the S&P 500 that are classified as members of the GICS information technology sector. The S&P 500 Daily Covered Call Index seeks to measure the performance of a long position in the S&P 500 TR and a short position in a standard S&P 500 daily call option, aiming to reflect higher income generation and lower timing risk by using daily options versus monthly options. The CBOE S&P 500 BuyWrite Index is a benchmark designed to show the hypothetical performance of a portfolio that engages in a buy-write strategy using S&P 500 call options. The Nasdaq-100 Index includes 100 of the largest domestic and international non-financial companies listed on the NASDAQ Stock Market based on market capitalization. The CBOE Nasdaq-100 BuyWrite V2 Index is a benchmark designed to show the hypothetical performance of a portfolio that engages in a buy-write strategy using Nasdaq-100 call options. The Russell 2000 Dividend Growth Index targets companies that are currently members of the Russell 2000 that have increased dividend payments each year for at least 10 years. The Bloomberg U.S. Aggregate Bond Index or "the Agg" is a broad-based fixed-income index used as a benchmark to measure bond market performance. The FTSE Nareit All Equity REITs Index is designed to measure the performance of real estate investment trusts (REITs). The DJ US Select Dividend Index aims to represent the U.S.'s leading stocks by dividend yield. The Alerian MLP Infrastructure Index is a composite of energy infrastructure Master Limited Partnerships (MLPs). The SNET Composite Closed-End Index is a rules-based index intended to give investors a means of tracking the overall performance of a global universe of U.S.-listed closed-end funds. THESE ENTITIES AND THEIR AFFILIATES MAKE NO WARRANTIES AND BEAR NO LIABILITY WITH RESPECT TO PROSHARES.
This is not intended to be investment advice. Indexes are unmanaged, and one cannot invest directly in an index. Past performance does not guarantee future results.
Any forward-looking statements herein are based on expectations of ProShare Advisors LLC at this time. Whether or not actual results and developments will conform to ProShare Advisors LLC’s expectations and predictions, however, is subject to a number of risks and uncertainties, including general economic, market and business conditions; changes in laws or regulations or other actions made by governmental authorities or regulatory bodies; and other world economic and political developments. ProShare Advisors LLC undertakes no duty to update or revise any forward-looking statements, whether as a result of new information, future events or otherwise.
Investing involves risk, including the possible loss of principal. This information is not meant to be investment advice.
The “S&P 500®,” “S&P 500® Dividend Aristocrats® Index,” “S&P MidCap 400® Dividend Aristocrats® Index” and “S&P 500 Daily Covered Call Index” are products of S&P Dow Jones Indices LLC and its affiliates and have been licensed for use by ProShare Advisors LLC. "S&P®" is a registered trademark of Standard & Poor’s Financial Services LLC (“S&P”), and “Dow Jones®" is a registered trademark of Dow Jones Trademark Holdings LLC (“Dow Jones”) and they have been licensed for use by S&P Dow Jones Indices LLC and its affiliates. ProShares ETFs based on these indexes are not sponsored, endorsed, sold or promoted by these entities or their affiliates, and they make no representation regarding the advisability of investing in ProShares ETFs. THESE ENTITIES AND THEIR AFFILIATES MAKE NO WARRANTIES AND BEAR NO LIABILITY WITH RESPECT TO PROSHARES.