Key Observations

While small-cap stocks made a move in July, they retreated slightly in August. Could their still attractive valuations coupled with this month’s expected Fed rate cuts finally turn the tide for a rotation into small caps, and what strategies are primed to make the most of it?
The long-awaited small-cap rotation appeared to arrive with a vengeance in July—the Russell 2000 Index returned more than 10% for the month compared to just over 1% for the S&P 500 (Source: Bloomberg). Then August came along and muddied the waters. Second quarter S&P 500 earnings were notably stronger than those of the Russell 2000, with large-cap and mega-cap stock performance to match. Valuation still seems to favor small caps, though, and performance did little to move that dial—price-to-book1 valuation for the Russell 2000 was still less than half that of the S&P 500.
The anticipated Fed rate cut this month could be just the catalyst to realize this valuation-driven opportunity. Small-cap interest rate sensitivity is one of the most widely accepted investment tenets, and a Fed rate cut cycle might deliver extra oomph to small-caps this time around.
Small Cap Leverage Has Increased (Net Debt to EBITDA)
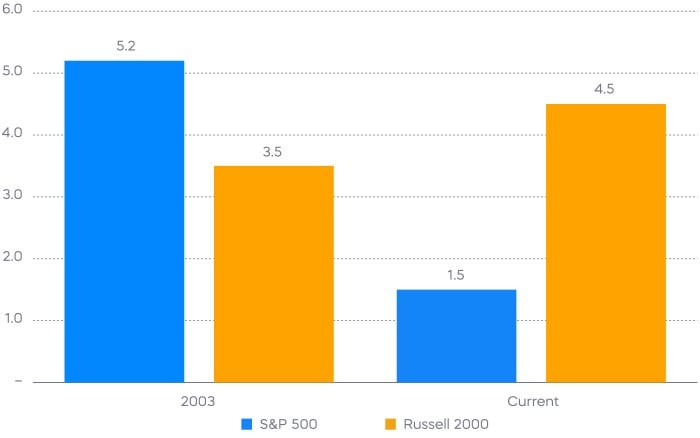
Source: Bloomberg, Data as of 9/3/24.
The interest rate sensitivity of small-cap stocks is largely attributable to the greater leverage of small caps versus large caps—smaller companies typically have to borrow more money. That is clearly true today, with the Russell 2000 having nearly triple the leverage of the S&P 500, as shown in the chart above. By itself, that difference is more than sufficient to point to small caps being outsized beneficiaries of rate cuts, as debt burden relief is typically more impactful for them.
The surprise here is, 20 years ago, that was not true—small caps typically had less leverage than large caps. The dramatic de-leveraging of large caps has been part and parcel of their long run of outperformance. But it also points to a perhaps muted reaction to pending rate cuts.
By contrast, the increased leverage of small caps since then is a manifestation of their protracted underperformance. And this presents a potential opportunity for an outsized positive reaction to expected rate cuts—July’s small-cap outperformance may not have been a false dawn after all.
Performance Recap
After the VIX Index spiked above 60 intraday on August 5, it experienced its largest two-week decline since the index’s inception, with large-cap equities ending the month in positive territory. However, cyclical sectors broadly underperformed defensive sectors, indicating a potential shift in market positioning. The U.S. dollar also weakened during the month, boosting international assets.
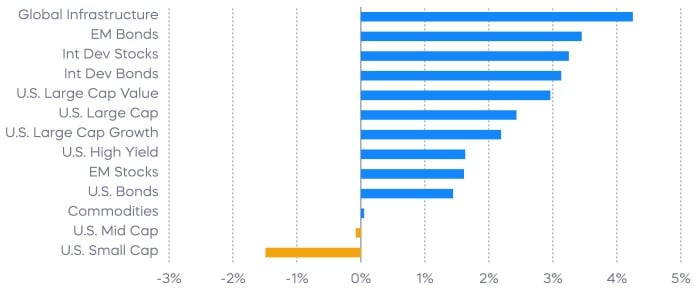
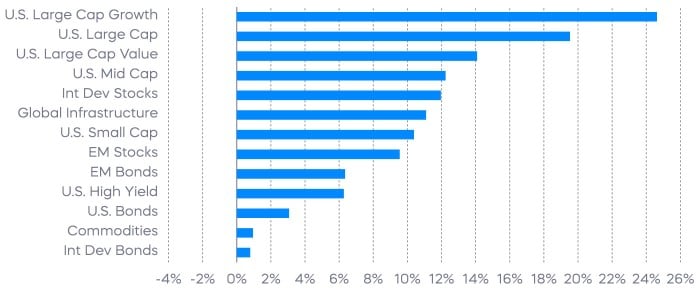
Source: Bloomberg. August returns 8/1/24–8/31/24; year-to-date returns 1/1/24‒8/31/24. Index returns are for illustrative purposes only and do not reflect any management fees, transaction costs or expenses. Indexes are unmanaged, and one cannot invest directly in an index. Past performance does not guarantee future results.
Economic Calendar
Here is a list of key and upcoming economic releases, which can serve as a guide to potential market indicators.
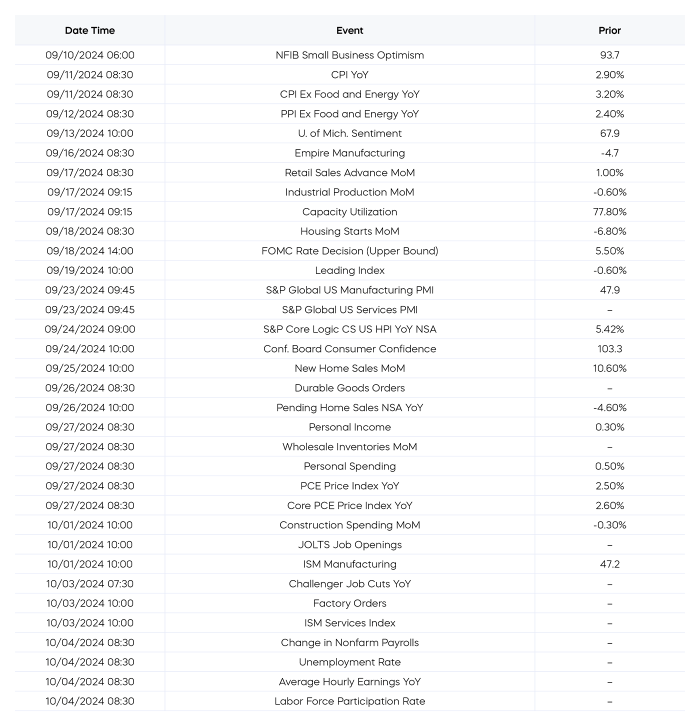
Source: Bloomberg. Data is as of 8/31/24.
Equity Perspectives

After a standout performance in July during which the Russell 2000 Index returned over 10%, small caps retreated slightly during August. Was July a false start for small-cap stocks, or was August just temporary noise? Our view is that small caps remain an intriguing opportunity and deserve consideration in most investment portfolios. And portfolios that have had a small-cap allocation are likely underweighted to them, given small caps’ general underperformance over the last decade.
Those looking for a catalyst to change things could be getting one this month courtesy of the Fed. While stocks have generally produced good results following prior rate-cut cycles, small caps have done particularly well. Looking back at the five most recent Fed rate-cut cycles, according to Bloomberg, small caps (Russell 2000) have on average outperformed large caps (S&P 500) following the end of the rate cuts. Recall that after the last Fed rate cut in March of 2020, small-cap stocks rocketed higher and returned over 126% during the next 12 months. Investors shouldn’t necessarily expect a repeat, but given today’s valuation levels and an expected small-cap earnings recovery, the start of a new rate-cut cycle might be just what small-cap bulls have been waiting for.
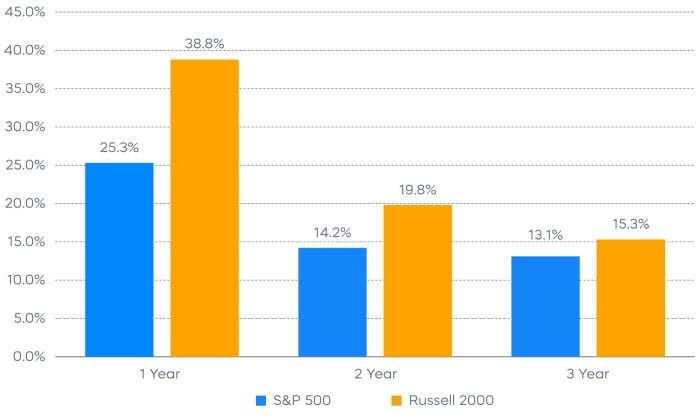
Source: Bloomberg. Data as of 7/31/24. Index returns are for illustrative purposes only and do not represent actual fund performance. Index returns do not reflect any management fees, transaction costs or expenses. Indexes are unmanaged and one cannot invest directly in an index. Past performance does not guarantee future results.
In addition to their typically compelling near-term total return outlook, small-cap stocks can also be an attractive source of income. Granted, using small caps—an asset class usually more associated with growth—to generate income may not be the most intuitive concept. But equity income investors have an increasingly interesting array of opportunities to consider.
For example, indexes like the Russell 2000 Dividend Growth Index offer a way to invest in high-quality small-cap companies that have continually grown their dividends for at least a decade. That index has historically delivered all-weather performance, outperforming the Russell 2000 Index over time with lower levels of volatility.
Small caps can also be an arena for covered call strategies. Covered call strategies on mainstream indexes like the S&P 500 and the Nasdaq-100 have been especially popular over the last few years for generating substantial annualized yields. In theory, those willing to forego a portion of their total returns can harvest generous income from small-cap stocks that are traditionally more volatile than their larger-cap peers.
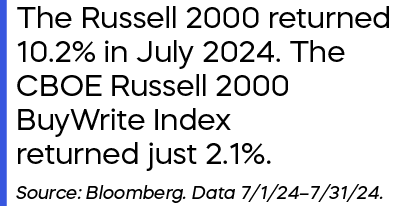 |
But here is the problem: the tradeoff between income and total return has been especially costly for traditional small cap covered call strategies. In fact, the total returns of the CBOE Russell 2000 BuyWrite Index—a proxy for a traditional covered call strategy utilizing options that expire every month—has provided only half of the total returns of the Russell 2000 Index. And data has shown that the bigger the rally, the bigger the potential sacrifice of returns. |
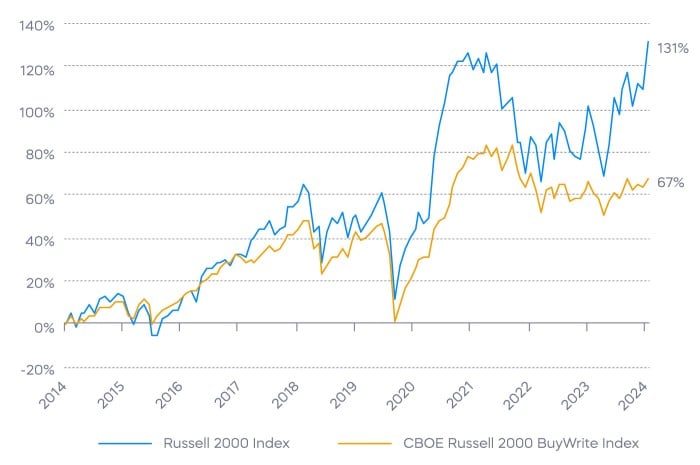
Source: Bloomberg. Cumulative total returns from 7/1/14–7/31/24. Index returns are for illustrative purposes only and do not represent actual fund performance. Index returns do not reflect any management fees, transaction costs or expenses. Indexes are unmanaged and one cannot invest directly in an index. Past performance does not guarantee future results.
Thankfully, recent innovations in the options market offer a potentially better solution. The new CBOE Russell 2000 Daily Covered Call Index improves the tradeoff between income and small-cap total return potential. By using daily call options, the index can participate in potential market gains, up to the strike price, each day they occur.
The CBOE Russell 2000 Daily Covered Call Index joins the S&P 500 Daily Covered Call Index and the Nasdaq-100 Daily Covered Call Index, which since inception have demonstrated how daily call writing strategies can capture returns that traditional monthly covered call writing strategies have sacrificed.
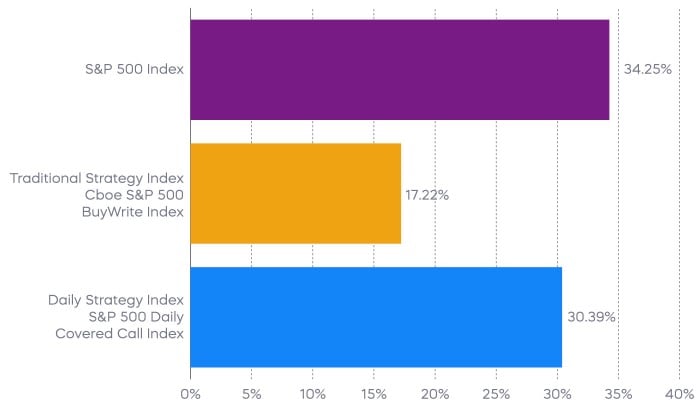
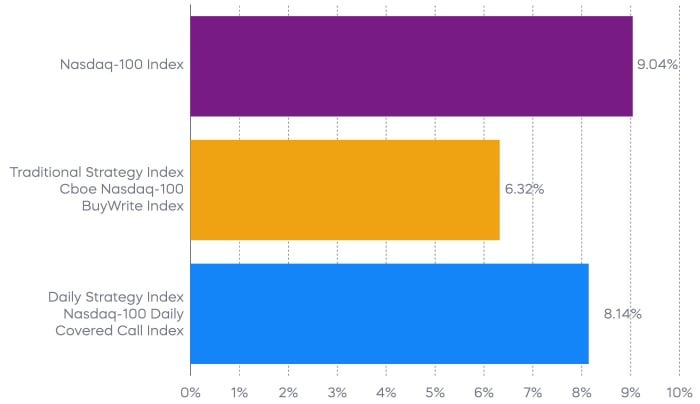
Source: Bloomberg. S&P 500 strategies data since inception of daily covered call index 10/5/23–8/31/24. Nasdaq-100 strategies data since inception of daily covered call index 3/11/24–8/31/24. Daily covered call indexes have very limited performance history, which should not be taken as an indication of future performance. Index returns are for illustrative purposes only and do not represent actual fund performance. Index returns do not reflect any management fees, transaction costs or expenses. Indexes are unmanaged and one cannot invest directly in an index. Past performance does not guarantee future results.
Fixed Income Perspectives

Rates continued to rally in August amid market volatility. Although credit spreads briefly widened at the start of August, they ultimately ended the month tighter or unchanged. Mortgage-backed securities outperformed Treasurys, with the 2s10s Treasury yield curve—the difference between 10-year and 2-year Treasury rates—approaching nearly flat. And following another month of strong performance, the global aggregate bond market has turned positive for 2024.
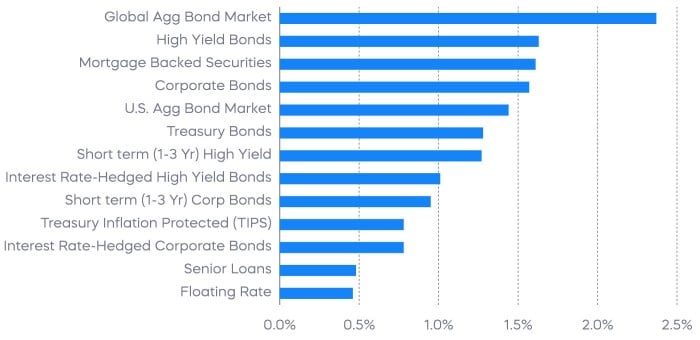
Source: Bloomberg. August returns 8/1/24‒8/31/24. Index returns are for illustrative purposes only and do not reflect any management fees, transaction costs or expenses. Indexes are unmanaged, and one cannot invest directly in an index. Past performance does not guarantee future results.
After an unexpected rise in the unemployment rate in July, both the markets and the Federal Reserve have shifted their focus from inflation to the labor market. We believe the Federal Reserve has been increasingly cognizant of the "two-sided" risk for some time, as job openings have declined to where further cooling could lead to higher unemployment (and trigger the Sahm Rule).
The market has since responded by pricing in a significant number of rate cuts. Over the next twelve months, Fed Fund futures are forecasting a more than 2% reduction in policy rates—a decline not seen outside of a recession since the mid-1980s.
In our view, the labor market is merely slowing to a more sustainable level, rather than signaling a hard landing. We believe the ultimate level of interest rates should be guided by the natural rate of interest as the Fed transitions its policy from restrictive to neutral, rather than easing into a recession.
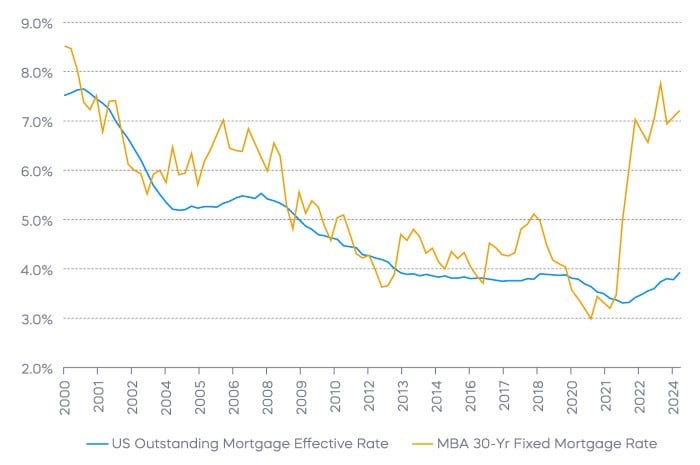
One scenario where the market's expectation of substantial rate cuts might be justified is based on the housing market's response. As interest rates and mortgage rates surged in 2022, home prices remained firm, which led to a significant decline in housing activity as existing homeowners held onto their low-rate mortgages. For housing market activity to rebound now, mortgage rates may need to drop considerably from current levels. A muted response to rate cuts could suggest a lower neutral policy rate for the economy.
On the other hand, the neutral policy rate will also depend on how private sector investments and other parts of the economy react. With corporate balance sheets seeming relatively strong and consumers still resilient, the Fed is likely to assess the path of monetary policy as the rate cut cycle progresses.
On a more tactical level, the typically strong investment-grade issuance seen in August and September has faced some disruption by recent market selloffs. With all-in yields at year-to-date lows, strong corporate bond supply in September could put upward pressures on long-term interest rates.
The upcoming November general election could also add to market volatility, particularly as tariffs—which were largely passed on to consumers through higher prices during 2018’s trade war—could keep residual inflation risks in play and potentially limit the extent of rate cuts by the Fed.
The different market segments represented in the performance recap charts use the following indexes: U.S. Large Cap: S&P 500 TR; U.S. Large Cap Growth: S&P 500 Growth TR; U.S. Large Cap Value: S&P 500 Value TR; U.S. Mid Cap: S&P Mid Cap TR; U.S. Small Cap: Russell 2000 TR; International Developed Stocks: MSCI Daily TR NET EAFE; Emerging Markets Stocks: MSCI Daily TR Net Emerging Markets; Global Infrastructure: Dow Jones Brookfield Global Infrastructure Composite; Commodities: Bloomberg Commodity TR; U.S. Bonds: Bloomberg U.S. Aggregate; U.S. High Yield: Bloomberg Corporate High Yield; International Developed Bonds: Bloomberg Global Agg ex-USD; Emerging Market Bonds: DBIQ Emerging Markets USD Liquid Balanced.
The different market segments represented in the fixed income returns charts use the following indexes: Global Agg Bond Market: Bloomberg Global-Aggregate Total Return Index Value Unhedged USD; Mortgage Backed Securities: Bloomberg U.S. MBS Index Total Return Value Unhedged USD; Treasury Bonds: Bloomberg U.S. Treasury Total Return Unhedged USD; U.S. Agg Bond Market: Bloomberg U.S. Agg Total Return Value Unhedged USD; Corporate Bonds: Bloomberg US Corporate Total Return Value Unhedged USD; High Yield Bonds: Bloomberg U.S. Corporate High Yield Total Return Index Value Unhedged USD; Interest Rate-Hedged High Yield Bonds: FTSE High Yield (Treasury Rate-Hedged) Index; Treasury Inflation Protected (TIPS): Bloomberg U.S. Treasury Inflation Notes TR Index Value Unhedged USD; Short term (1-3 Yr) High Yield: Bloomberg U.S. Corporate 0-3 Year Total Return Index Value Unhedged USD; Senior Loans: Morningstar LSTA U.S. Leveraged Loan 100 Index; Short term (1-3 Yr) Corp Bonds: Bloomberg U.S. Corporate 1-3 Yr Total Return Index Value Unhedged USD; Floating Rate: Bloomberg U.S. FRN < 5 yrs Total Return Index Value Unhedged USD; Interest Rate-Hedged Corporate Bonds: FTSE Corporate Investment Grade (Treasury Rate-Hedged) Index.
The S&P 500 is a benchmark index published by Standard & Poor's (S&P) representing 500 companies with large-cap market capitalizations. The S&P 500 Daily Covered Call Index seeks to measure the performance of a long position in the S&P 500 TR and a short position in a standard S&P 500 daily call option, aiming to reflect higher income generation and lower timing risk by using daily options versus monthly options. The CBOE S&P 500 BuyWrite Index is a benchmark designed to show the hypothetical performance of a portfolio that engages in a buy-write strategy using S&P 500 call options. The Russell 2000 Index is a small-cap U.S. stock market index that makes up the smallest 2,000 stocks in the Russell Index. The Russell 2000 Dividend Growth Index targets companies that are currently members of the Russell 2000 that have increased dividend payments each year for at least 10 years. The CBOE Russell 2000 Daily Covered Call index consists of a long position in the Russell 2000 Total Return Index and a short position in an out-of-the-money Russell 2000 Index call option, aiming to reflect higher income generation and lower timing risk by using daily options versus monthly options. The Nasdaq-100 Index includes 100 of the largest domestic and international non-financial companies listed on the NASDAQ Stock Market based on market capitalization. The Nasdaq-100 Daily Covered Call Index seeks to measure the performance of a long position in the Nasdaq-100 Total Return Index and a short position in an out-of-the-money Nasdaq-100 Index call option, aiming to reflect higher income generation and lower timing risk by using daily options versus monthly options. The CBOE Nasdaq-100 BuyWrite V2 Index is a benchmark designed to show the hypothetical performance of a portfolio that engages in a buy-write strategy using Nasdaq-100 call options. The VIX Index is a calculation designed to produce a measure of constant, 30-day expected volatility of the U.S. stock market, derived from real-time, mid-quote prices of S&P 500® Index (SPX℠) call and put options. THESE ENTITIES AND THEIR AFFILIATES MAKE NO WARRANTIES AND BEAR NO LIABILITY WITH RESPECT TO PROSHARES.
This is not intended to be investment advice. Indexes are unmanaged, and one cannot invest directly in an index. Past performance does not guarantee future results.
Any forward-looking statements herein are based on expectations of ProShare Advisors LLC at this time. Whether or not actual results and developments will conform to ProShare Advisors LLC’s expectations and predictions, however, is subject to a number of risks and uncertainties, including general economic, market and business conditions; changes in laws or regulations or other actions made by governmental authorities or regulatory bodies; and other world economic and political developments. ProShare Advisors LLC undertakes no duty to update or revise any forward-looking statements, whether as a result of new information, future events or otherwise.
Investing involves risk, including the possible loss of principal. This information is not meant to be investment advice.
The “S&P 500®,” and “S&P 500 Daily Covered Call Index” are products of S&P Dow Jones Indices LLC and its affiliates and have been licensed for use by ProShare Advisors LLC. "S&P®" is a registered trademark of Standard & Poor’s Financial Services LLC (“S&P”), and “Dow Jones®" is a registered trademark of Dow Jones Trademark Holdings LLC (“Dow Jones”) and they have been licensed for use by S&P Dow Jones Indices LLC and its affiliates. "VIX®" is a trademark of the Chicago Board Options Exchange, Incorporated ("Cboe") and has been licensed for use by S&P Dow Jones Indices LLC. London Stock Exchange Group plc and its group undertakings (collectively, the “LSE Group”), © LSE Group 2024. FTSE Russell is a trading name of certain of the LSE Group companies. The “Cboe Russell 2000 Daily Covered Call Index” and “Russell®” are trademarks of the relevant LSE Group companies and are used by any other LSE Group company under license. Nasdaq®, Nasdaq-100 Index®, Nasdaq-100®, NDX®, Nasdaq-100 Daily Covered Call™ Index, NDXDCC™, Nasdaq-100 Daily Covered Call Option™ Index, NDXDCCOV™, Nasdaq-100 Daily Covered Call Income™ Index, NDXDCCI™, are registered trademarks of Nasdaq, Inc. (which with its affiliates and third party licensors is referred to as the “Corporations”) and are licensed for use by ProShare Advisors LLC. ProShares ETFs based on these indexes are not sponsored, endorsed, sold or promoted by these entities or their affiliates, and they make no representation regarding the advisability of investing in ProShares ETFs. THESE ENTITIES AND THEIR AFFILIATES MAKE NO WARRANTIES AND BEAR NO LIABILITY WITH RESPECT TO PROSHARES