Key Observations

There’s a Case for Optimism in the Year Ahead
Stocks had a strong 2024, with the S&P 500 up 25% for the year.[1] That means investors, many of whom are worried about stock valuations, have much to consider heading into 2025. Will policy changes be enduringly bullish for stocks? How strong are the fundamentals supporting the current rally? What might the rate-setters at the Federal Reserve do?
Our characterization of the year ahead? There seems reason for some exuberance—but a rational exuberance, based upon a plausible foundation of corporate and economic health. Our key observations for 2025 include:
- Stocks May Have Less Risk Than You Think
- Fixed Income Markets Face Challenges
- Bitcoin May Be a Diversifier
Stocks May Have Less Risk Than You Think
There’s no getting around the fact that stocks are expensive. With the 10-year Treasury yield near its long-term average of 4-4.5%, a typical range for a stock’s trailing price-to-earnings (P/E) multiple would be 18-20X.[2] It currently stands at roughly 24.6X.[3] What might have changed to make an elevated P/E multiple be less risky for investors? The answer is leverage. Stocks have less than a third of the leverage today than they had 20 years ago, with S&P 500 net debt/EBITDA falling from over 4X to over 1X today. That is a substantial reduction in financial risk.
S&P 500 Stocks Have Substantially Less Leverage Than in the Past (Net Debt to EBITDA)
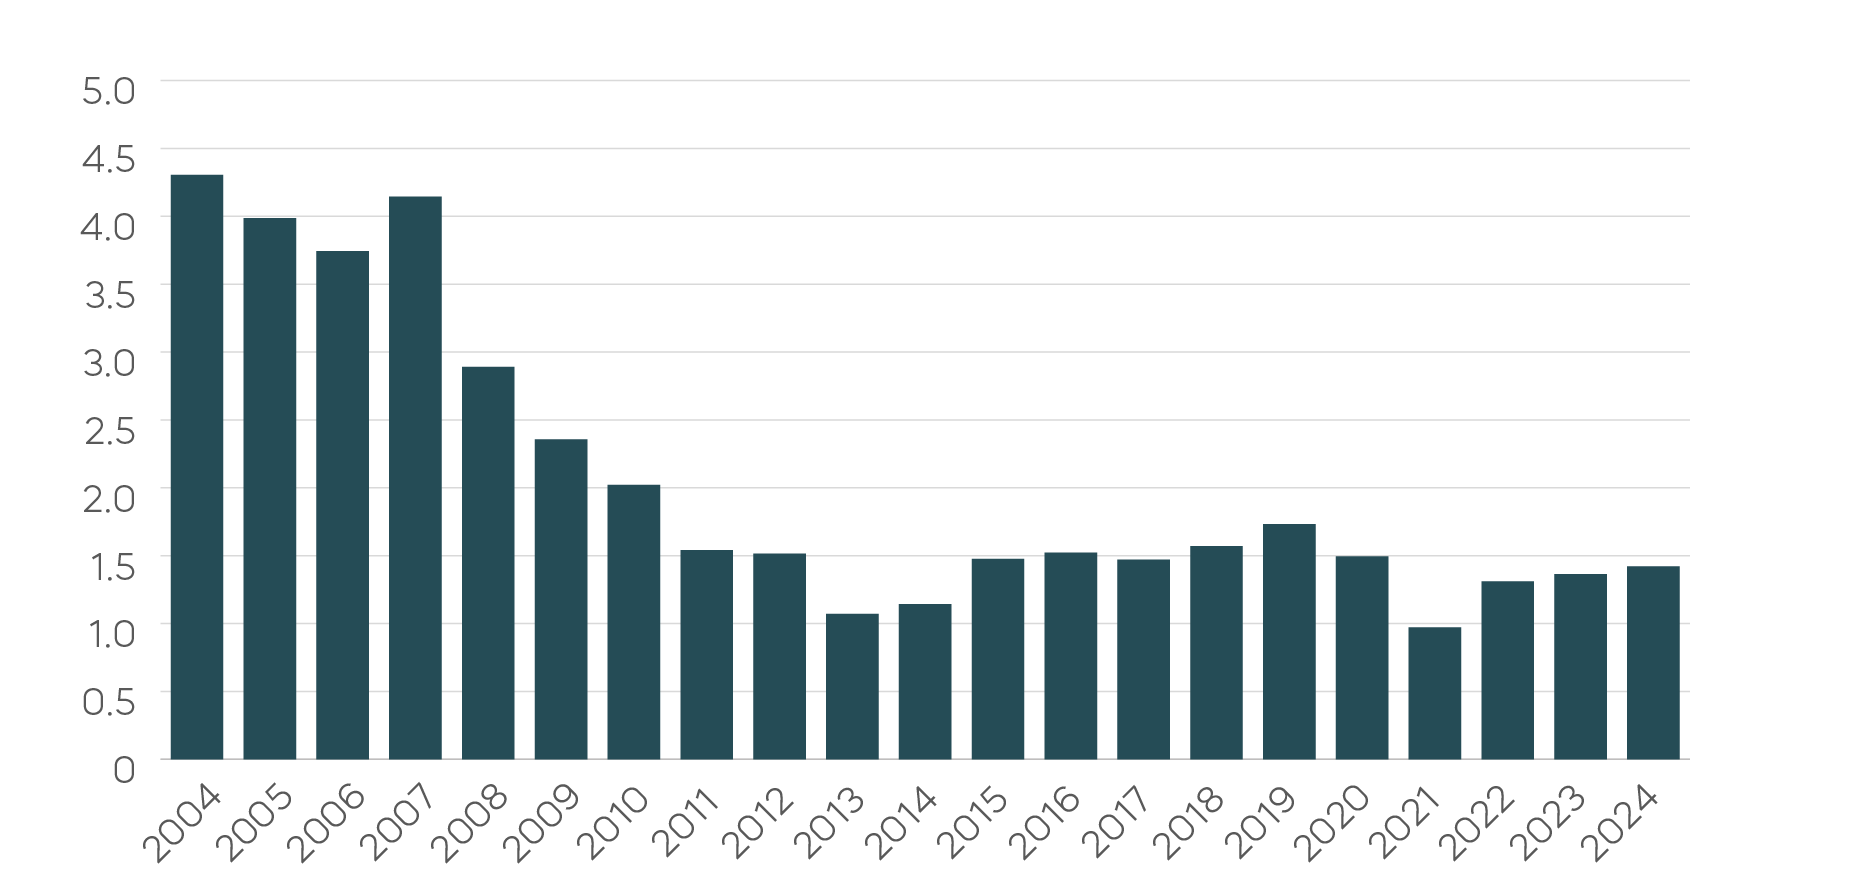
Bloomberg data as of 12/5/24. Net debt/ EBITDA measures a company’s ability to pay off its debt by utilizing earnings before interest, taxes, depreciation and amortization (EBITDA). Past performance does not guarantee future results. Index calculations do not reflect any management fees, transaction costs or expenses. Indexes are unmanaged, and one cannot invest directly in an index.
Another way to illustrate today’s currently lower levels of leverage is to compare the return on assets (ROA) of the S&P 500 with return on equity (ROE).
S&P 500 Return on Assets vs. Return on Equity
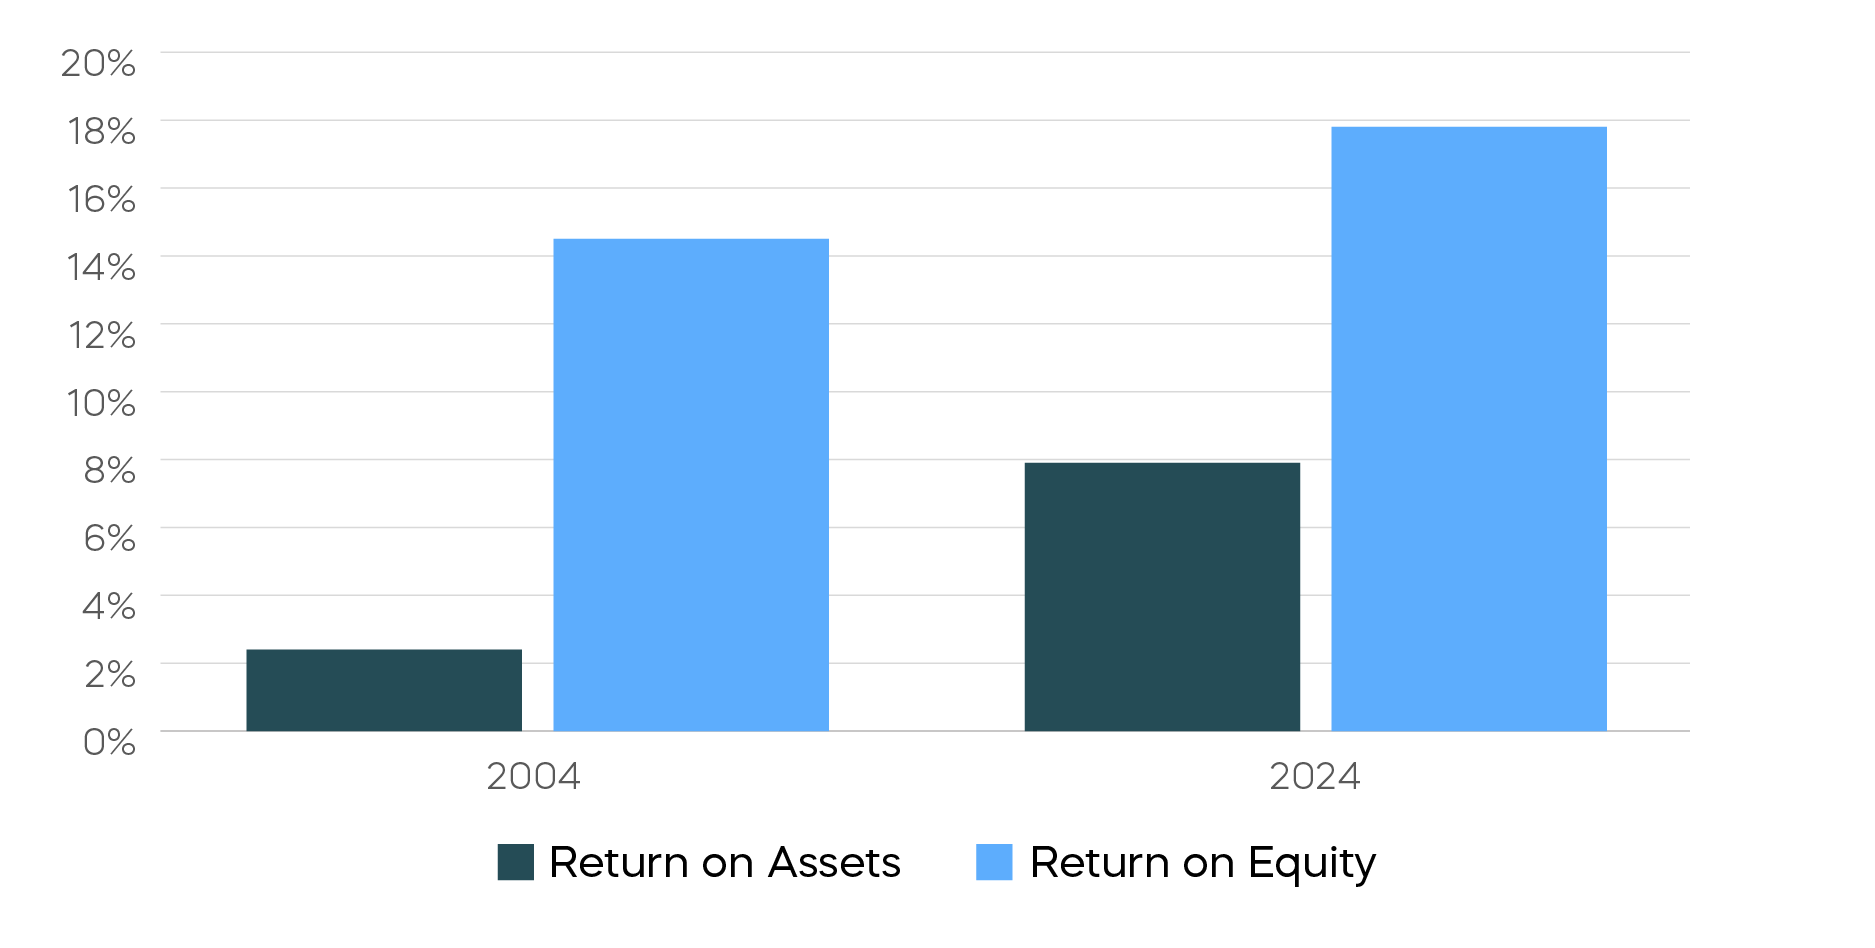
Source: Bloomberg data as of 12/5/2024. Return on equity is a measure of profitability calculated by dividing net income by shareholder equity. Return on assets measures how efficiently a company is using its assets to generate profits, calculated by dividing net income by total assets. Past performance does not guarantee future results. Index calculations do not reflect any management fees, transaction costs or expenses. Indexes are unmanaged, and one cannot invest directly in an index.
Investors who simply look at this comparison would see a notable, albeit unremarkable, increase in ROE from 20 years ago. But ROE is driven by two components: the ROA of the underlying business and the amount of leverage that converts the ROA into ROE. As shown in the chart above:
- In 2004, high leverage drove an ROE that was six times that of the ROA of the underlying business, while in 2024 that multiple was just a bit more than two times.
- Today, the profitability of the underlying business of the S&P 500—the ROA—is more than triple that of 20 years ago.
Is that improved ROA enough to justify a 25X P/E multiple? It could be. The significant decline in leverage of the S&P 500 and the robustness of today’s profitability (due in part to the technology sector) suggests that at least some of the exuberance that drove expanding multiples may, in fact, be rational.
Fixed Income Markets Face Challenges
There are two key challenges facing fixed income investors in 2025:
- The risk of inflation
- Tight credit spreads
Possible tax cuts and tariffs do pose a potential inflation risk. Here’s how that might play out for bonds: If history is a guide, the real yield on the 10-year Treasury should be between 2%-2.5%. Thus, if inflation gets down to the Fed’s 2% target, the resulting 10-year Treasury yield should be 4%-4.5%. But if inflation stays persistently closer to 3%, that 10-year Treasury yield could rise to over 5%.
The federal funds rate tells a similar tale. A 10-year Treasury yield roughly 1.5% higher than the federal funds rate is a good long-term rule of thumb. So, if the rate eventually gets down to 3%, we are looking at that same 4.5% yield. But if inflationary pressures stop the Fed at 3.5% or more, we might end up with that 5% handle. Since yields up means prices drop, there could be a price risk for longer- term Treasurys.
Corporate bonds may face challenges as well. In addition to interest rate risk, credit spreads are tight, with both high yield and investment grade spreads close to half of their 20-year average.
Corporate Bond Spreads Are Tight
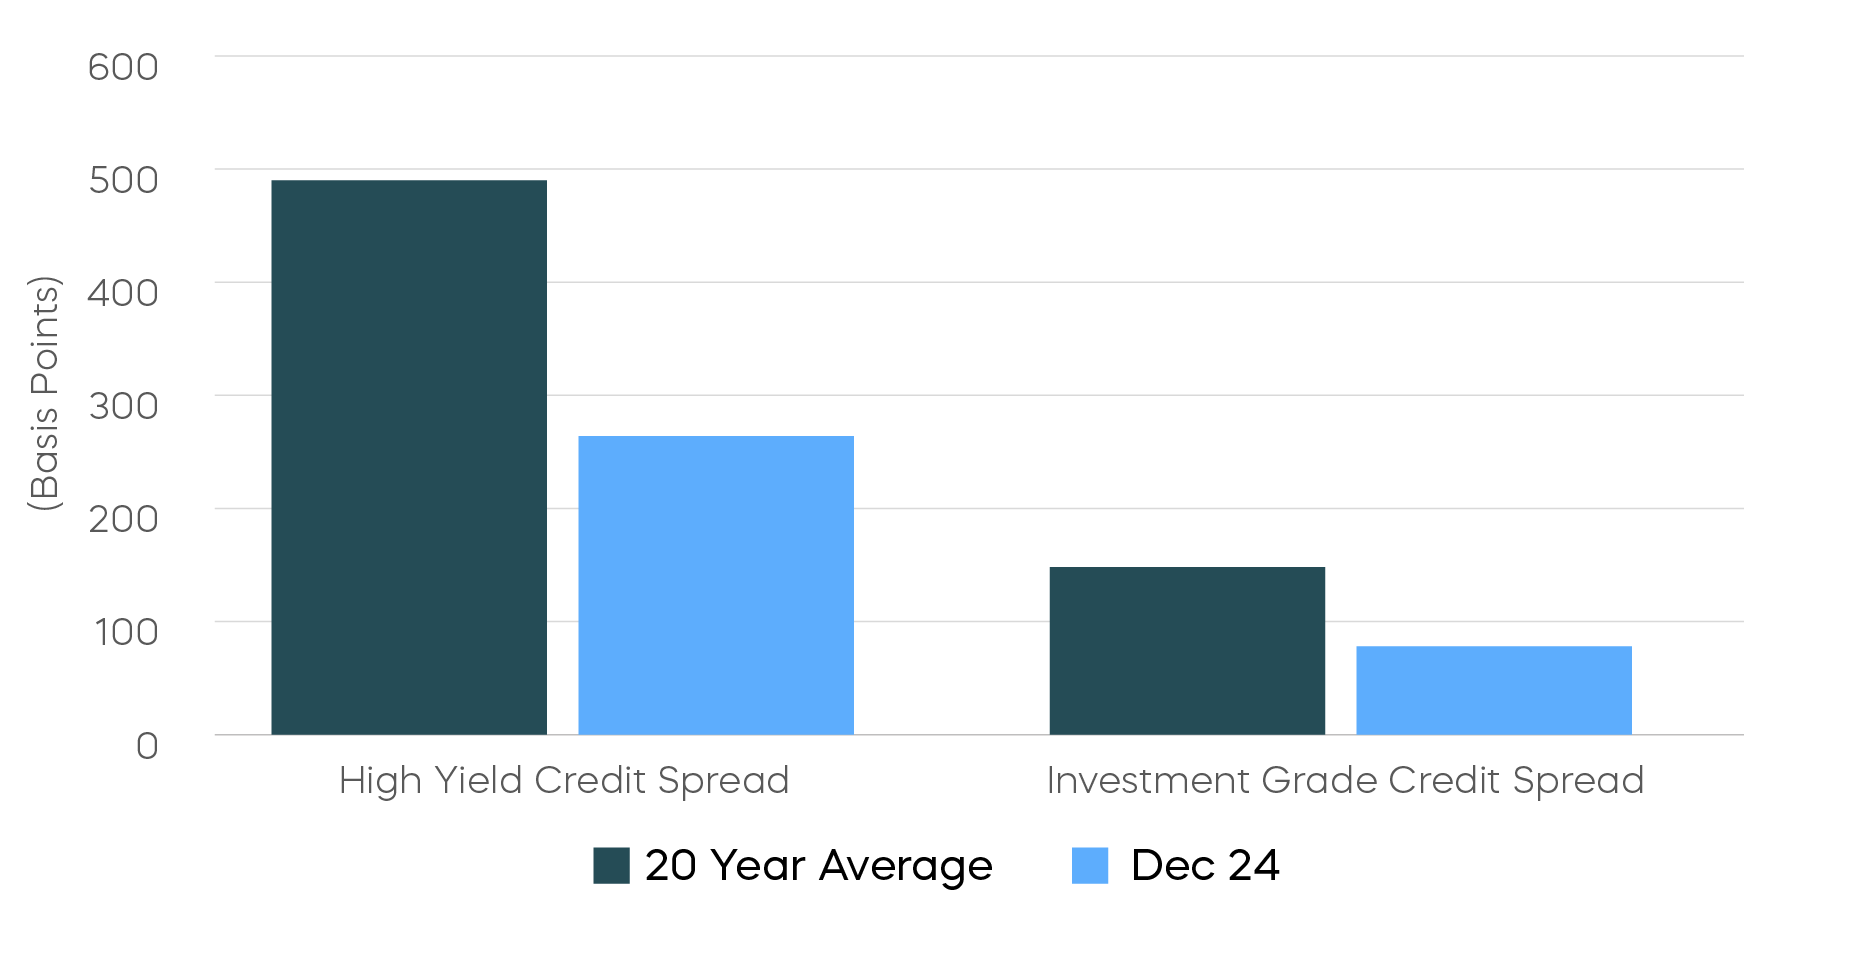
Source: Bloomberg data as of 12/2/2024. Past performance does not guarantee future results. Index calculations do not reflect any management fees, transaction costs or expenses. Indexes are unmanaged, and one cannot invest in an index.
That’s a tough trade for bonds at a time when stocks may look more appealing. For stocks, lower corporate leverage translates into a little less risk, so the potential market upside for equities is a fair trade. Corporate bonds, on the other hand, offer little additional yield, little upside potential, and the added risk that spreads could widen and prices fall.
Bitcoin May Be a Diversifier
Bitcoin’s record run to $100,000 in late 2024 has made headlines, but asset allocators have another reason to consider the cryptocurrency.
Given its meteoric rise, there is an increasingly common view that bitcoin is a risk asset like others, and that it will generally rise and fall with the stock market. That isn’t necessarily true.
Bitcoin Has Shown Low Correlation to the Stock Market
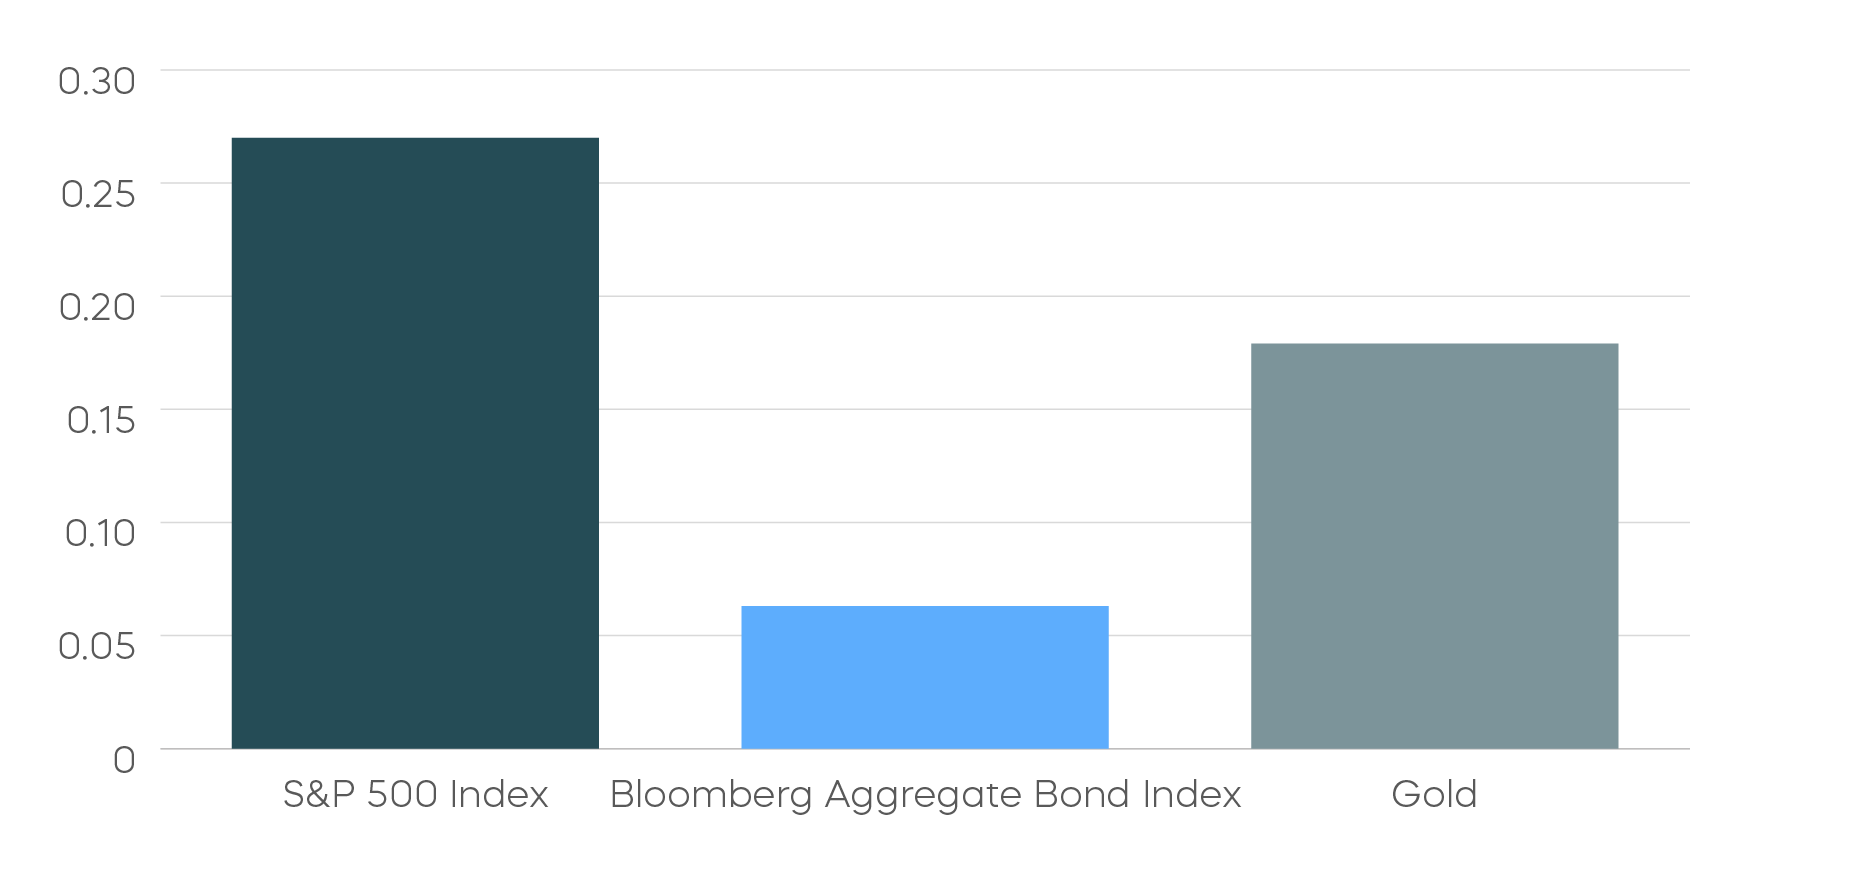
Source: Bloomberg, data as of 12/2/24. Past performance does not guarantee future results. Index calculations do not reflect any management fees, transaction costs or expenses. Indexes are unmanaged, and one cannot invest directly in an index.
In fact, bitcoin has shown quite low correlation to the stock market over time, as the chart above shows. It has also demonstrated low correlations to bonds and even gold, two key pillars of diversification from equities.
If these correlations cause you to raise an eyebrow, consider the following: During the regional banking crisis in early 2023, which saw the failure of crypto-related banks, bitcoin was surprisingly resilient. March of 2023 saw the S&P 500 Financials Sector fall nearly 10%, while bitcoin rallied over 22%.[4] Without arguing over whether bitcoin’s current record price is justified, investors should remember that the addition of a small amount of a volatile and uncorrelated asset to a portfolio has the potential to materially increase portfolio efficiency.
Performance Recap
US Large Cap Growth topped the charts for 2024. Sector composition and dollar strength were headwinds for international stocks.
Asset Class Returns—2024
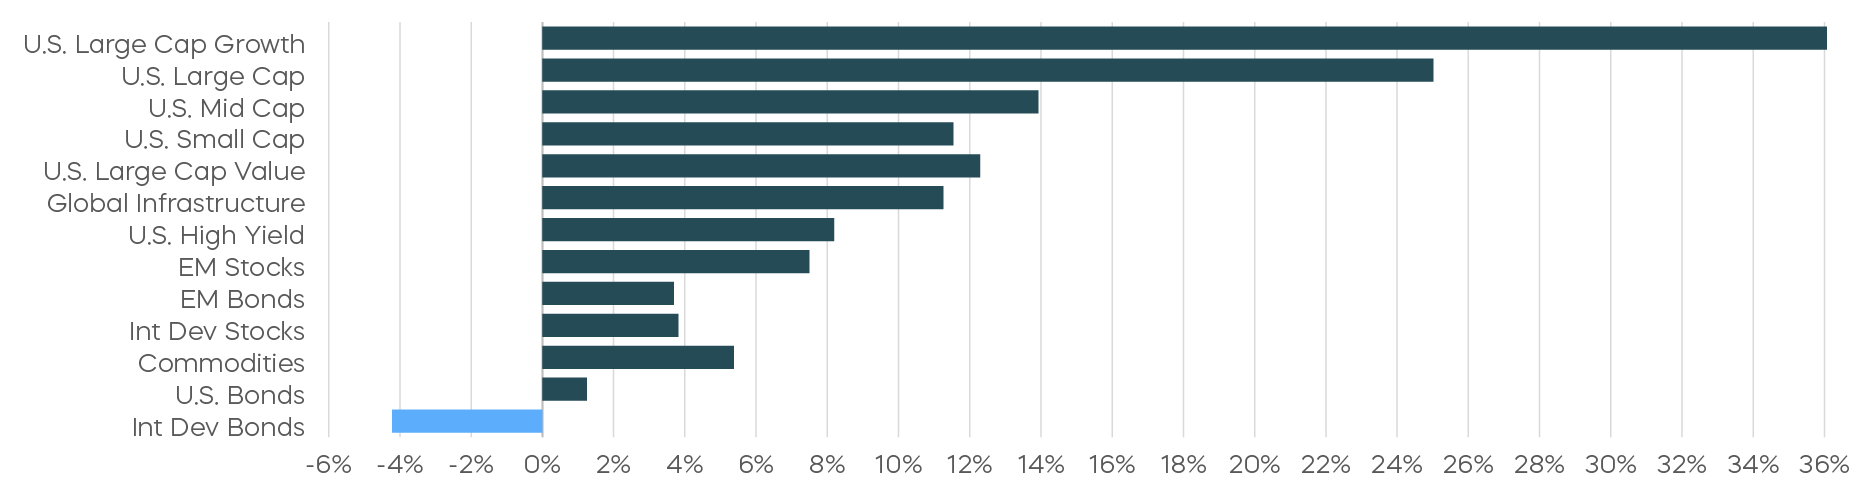
Source: Bloomberg. December returns 12/1/24–12/31/24; year-to-date returns 1/1/24‒12/31/24. Index returns are for illustrative purposes only and do not reflect any management fees, transaction costs or expenses. Indexes are unmanaged, and one cannot invest directly in an index. Past performance does not guarantee future results.
Sign up for Gearing Up
A daily newsletter for geared (leveraged and inverse) ETF investors, featuring:
- ProShares Daily Bull/Bear Indicator
- Key movements and trends
- Market commentary tailored for geared ETF investors
[1] Source: Bloomberg, data as of 01/06/25.
[2] Price-to-earnings (P/E) shows how much investors are paying for a dollar of a company’s earnings. P/E helps to assess the relative value of a company’s stock by measuring its share price relative to its earnings. A high P/E could mean that a stock is overvalued.
[3] Source: Bloomberg, data as of 01/06/25.
[4] Source: Bloomberg, data from 3/1/23 to 3/31/23.
Sources for data and statistics: Bloomberg, FactSet, Morningstar, and ProShares.
The different market segments represented in the performance recap charts use the following indexes: U.S. Large Cap: S&P 500 TR; U.S. Large Cap Growth: S&P 500 Growth TR; U.S. Large Cap Value: S&P 500 Value TR; U.S. Mid Cap: S&P Mid Cap TR; U.S. Small Cap: Russell 2000 TR; International Developed Stocks: MSCI Daily TR NET EAFE; Emerging Markets Stocks: MSCI Daily TR Net Emerging Markets; Global Infrastructure: Dow Jones Brookfield Global Infrastructure Composite; Commodities: Bloomberg Commodity TR; U.S. Bonds: Bloomberg U.S. Aggregate; U.S. High Yield: Bloomberg Corporate High Yield; International Developed Bonds: Bloomberg Global Agg ex-USD; Emerging Market Bonds: DBIQ Emerging Markets USD Liquid Balanced.
The different market segments represented in the fixed income returns charts use the following indexes: Global Agg Bond Market: Bloomberg Global-Aggregate Total Return Index Value Unhedged USD; Mortgage Backed Securities: Bloomberg U.S. MBS Index Total Return Value Unhedged USD; Treasury Bonds: Bloomberg U.S. Treasury Total Return Unhedged USD; U.S. Agg Bond Market: Bloomberg U.S. Agg Total Return Value Unhedged USD; Corporate Bonds: Bloomberg US Corporate Total Return Value Unhedged USD; High Yield Bonds: Bloomberg U.S. Corporate High Yield Total Return Index Value Unhedged USD; Interest Rate-Hedged High Yield Bonds: FTSE High Yield (Treasury Rate-Hedged) Index; Treasury Inflation Protected (TIPS): Bloomberg U.S. Treasury Inflation Notes TR Index Value Unhedged USD; Short term (1-3 Yr) High Yield: Bloomberg U.S. Corporate 0-3 Year Total Return Index Value Unhedged USD; Senior Loans: Morningstar LSTA U.S. Leveraged Loan 100 Index; Short term (1-3 Yr) Corp Bonds: Bloomberg U.S. Corporate 1-3 Yr Total Return Index Value Unhedged USD; Floating Rate: Bloomberg U.S. FRN < 5 yrs Total Return Index Value Unhedged USD; Interest Rate-Hedged Corporate Bonds: FTSE Corporate Investment Grade (Treasury Rate-Hedged) Index.
The S&P 500 is a benchmark index published by Standard & Poor's (S&P) representing 500 companies with large-cap market capitalizations. The S&P 500 Daily Covered Call Index seeks to measure the performance of a long position in the S&P 500 TR and a short position in a standard S&P 500 daily call option, aiming to reflect higher income generation and lower timing risk by using daily options versus monthly options. The S&P 500 Dividend Aristocrats Index targets companies that are currently members of the S&P 500 that have increased dividend payments each year for at least 25 years. The S&P MidCap 400 is a benchmark index published by Standard & Poor's (S&P) representing 400 companies with mid-cap market capitalizations. The S&P MidCap 400 Dividend Aristocrats Index targets companies that are currently members of the S&P MidCap 400 that have increased dividend payments each year for at least 15 years. The S&P 500 Growth Index measures constituents from the S&P 500 that are classified as growth stocks based on three factors: sales growth, the ratio of earnings change to price, and momentum. The S&P 500 Momentum Index measures the performance of securities in the S&P 500 universe that exhibit persistence in their relative performance. The S&P SmallCap 600 is a benchmark index published by Standard & Poor's (S&P) representing 600 companies with small-cap market capitalizations. The Russell 2000 Index is a small-cap U.S. stock market index that makes up the smallest 2,000 stocks in the Russell Index. The Russell 2000 Dividend Growth Index targets companies that are currently members of the Russell 2000 that have increased dividend payments each year for at least 10 years. The CBOE S&P 500 BuyWrite Index is a benchmark designed to show the hypothetical performance of a portfolio that engages in a buy-write strategy using S&P 500 call options. The Bloomberg U.S. Aggregate Bond Index or "the Agg" is a broad-based fixed-income index used as a benchmark to measure bond market performance. The Merrill Lynch Option Volatility Estimate (MOVE) Index is a measure of price volatility in government bonds. The Bloomberg U.S. Economic Surprise Index is a quantitative measure of how economic data releases compare to market expectations. THESE ENTITIES AND THEIR AFFILIATES MAKE NO WARRANTIES AND BEAR NO LIABILITY WITH RESPECT TO PROSHARES.
This is not intended to be investment advice. Indexes are unmanaged, and one cannot invest directly in an index. Past performance does not guarantee future results.
Any forward-looking statements herein are based on expectations of ProShare Advisors LLC at this time. Whether or not actual results and developments will conform to ProShare Advisors LLC’s expectations and predictions, however, is subject to a number of risks and uncertainties, including general economic, market and business conditions; changes in laws or regulations or other actions made by governmental authorities or regulatory bodies; and other world economic and political developments. ProShare Advisors LLC undertakes no duty to update or revise any forward-looking statements, whether as a result of new information, future events or otherwise.
Investing involves risk, including the possible loss of principal. This information is not meant to be investment advice.
The “S&P 500®,” “S&P MidCap400,” “S&P 500 Daily Covered Call Index,” “S&P 500® Dividend Aristocrats® Index,” “S&P MidCap 400® Dividend Aristocrats® Index,” “S&P SmallCap 600,” and “S&P 500 Daily Covered Call Index” are products of S&P Dow Jones Indices LLC and its affiliates and have been licensed for use by ProShare Advisors LLC. "S&P®" is a registered trademark of Standard & Poor’s Financial Services LLC (“S&P”), and “Dow Jones®" is a registered trademark of Dow Jones Trademark Holdings LLC (“Dow Jones”) and they have been licensed for use by S&P Dow Jones Indices LLC and its affiliates. FTSE Russell is a trading name of certain of the LSE Group companies. ProShares ETFs based on these indexes are not sponsored, endorsed, sold or promoted by these entities or their affiliates, and they make no representation regarding the advisability of investing in ProShares ETFs. THESE ENTITIES AND THEIR AFFILIATES MAKE NO WARRANTIES AND BEAR NO LIABILITY WITH RESPECT TO PROSHARES.