By Dr. Rufus Rankin and Simeon Hyman, CFA
Key Observations
- Bonds have historically provided and can continue to provide true diversification to equity portfolios.
- Traditional monthly covered call strategies, while offering income, have not delivered the total return of equities nor provided any significant diversification benefits.
- With the innovative use of daily options in covered call strategies, investors can now generate substantial income while still capturing more equity-like total returns. They can potentially have a better balance between income generation, total return, and risk management in their portfolios.
Jump To:
- A New Approach to Equity Income
- Part 1: The Covered Call Conundrum
- Part 2: How Stock/Bond Correlation Can Change Over Time
- Part 3: A Daily Advantage for Covered Calls
A New Approach to Equity Income
Covered call strategies have become very popular with income-seeking investors. However, traditional monthly covered call strategies come with a costly trade-off, as their income-producing features may sacrifice much of the total return of the underlying equities. Covered call strategies using daily options offer an innovative solution to this shortcoming.
Some investors acknowledge the trade-off in total return, believing that traditional monthly covered call strategies can reduce equity risk. Unfortunately, these strategies have neither delivered the total return of equities nor provided any meaningful diversification benefit.
This insight—that traditional covered call strategies may impair investors’ total return while failing to add portfolio diversification—is critical for investors seeking growth and income. In this article, we will demonstrate how the use of daily options within a covered call strategy has the potential to generate substantial income while also targeting the total return of equities. In addition, we will illustrate how bonds have historically added—and can continue to add—true diversification to equity portfolios.
Part 1: The Covered Call Conundrum
Covered call strategies have become popular because they generate significant yields in the form of monthly premiums. These are relatively simple strategies in which a trader sells a call option while simultaneously owning the underlying stock or index, earning a premium. The downside to this approach is that it limits much of the upside potential of the underlying assets, which can be substantial over time. Over the last ten years the Cboe S&P 500 BuyWrite Index (BXM)—a benchmark for a traditional monthly covered call strategy—has delivered only one-third the return of the S&P 500.
Many income-minded investors console themselves with this trade-off by assuming, or expecting, that a covered call strategy will reduce the risk of their equity exposure. This is not necessarily the case, as this article will demonstrate.
To illustrate how covered call strategies might perform during times of market stress, we can test three different hypothetical portfolios during the Global Financial Crisis (GFC).
- Portfolio 1 represents a baseline 60% stock/40% bond portfolio.
- Portfolio 2 assumes an investor "had a feeling" before the GFC that things were going to get bad, and decided to adjust their 60/40 allocation by moving an additional 20% out of stocks into bonds.
- Portfolio 3 reflects shifting 10% each from the stocks and bonds in the hypothetical Portfolio 1 into a covered call index, resulting in a 50% stocks/30% bonds/20% covered call allocation.
Hypothetical Performance of Global Financial Crisis Portfolio
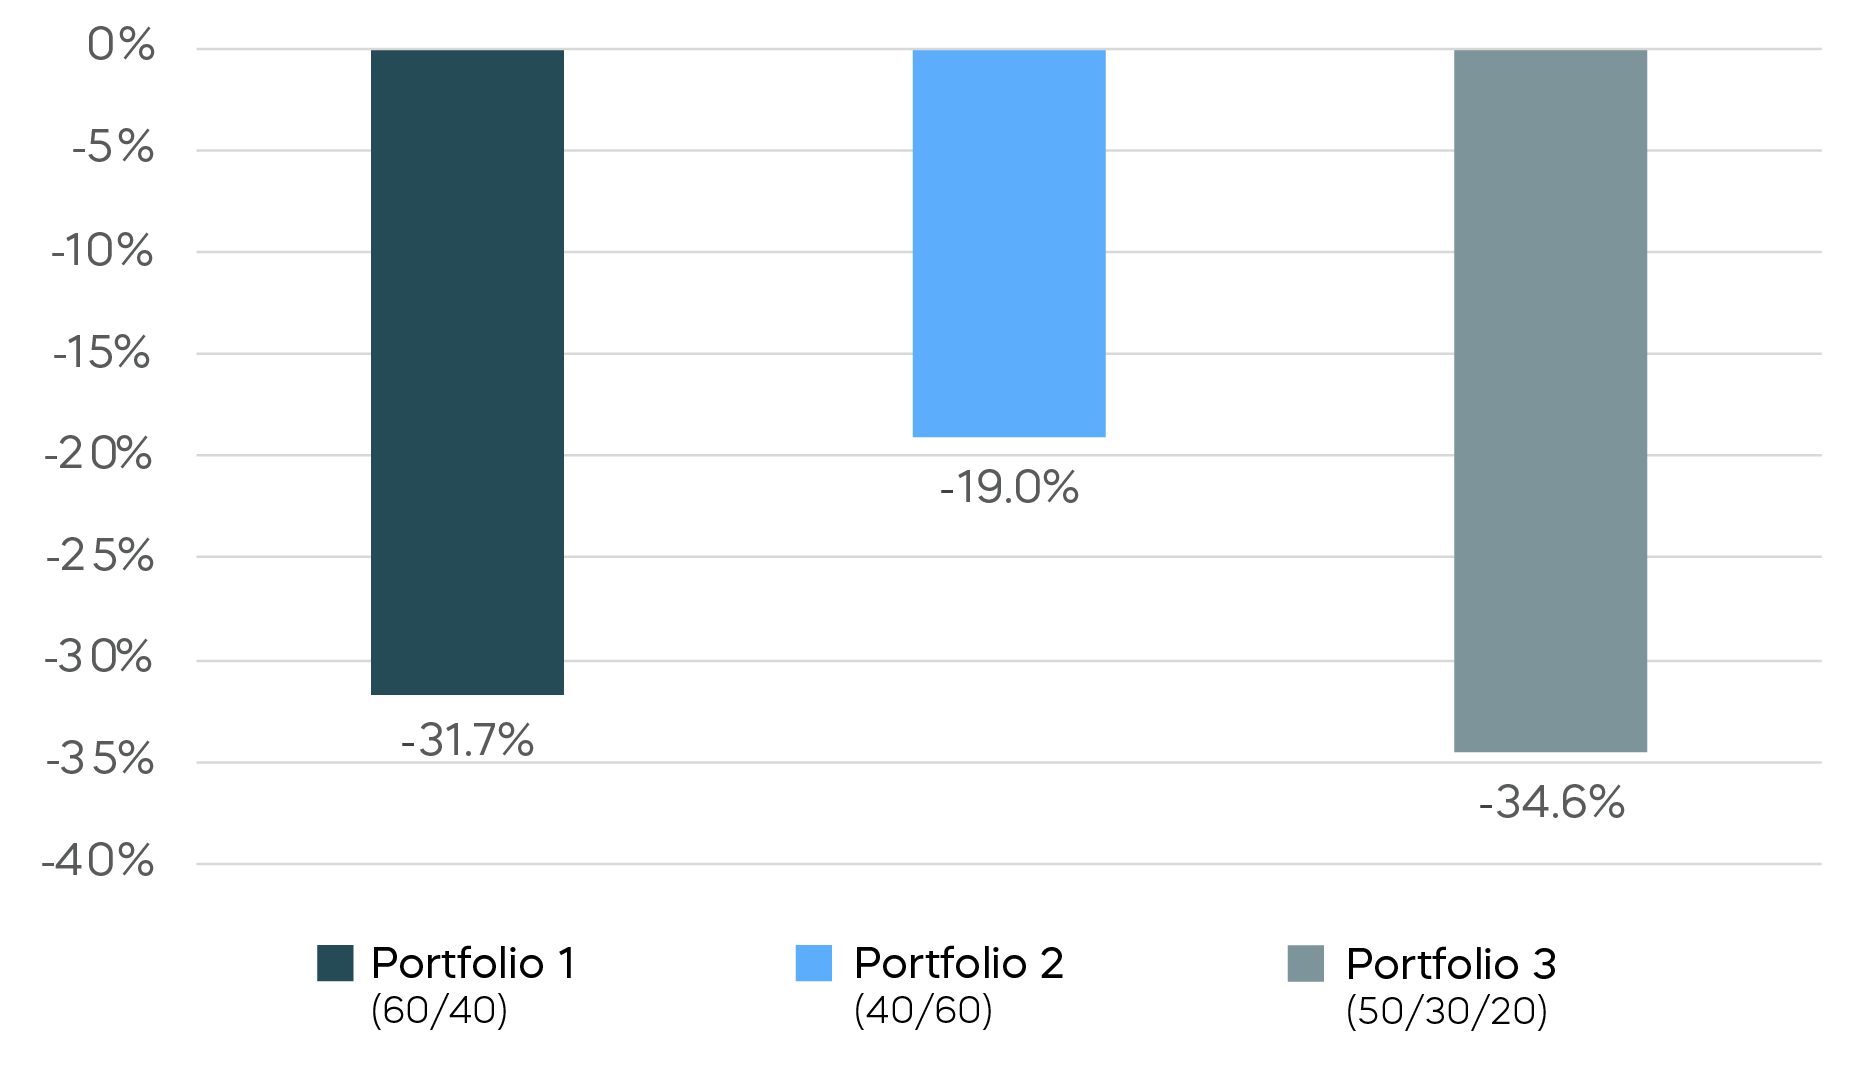
While adding more to bonds helped significantly, adding covered calls did not make a material difference during this period. The portfolio that included 20% in covered calls—Portfolio 3—lost 34.6%, worse than the 31.7% loss experienced by the traditional 60/40 portfolio (Portfolio 1). In contrast, the portfolio that increased its bond allocation, reversing the standard 60/40 to a 40/60 mix, lost only 19%, a substantial reduction of about 40%.
Part 2: How Stock/Bond Correlation Can Change Over Time
One of the most popular assets to pair with stocks is bonds, both corporate and government. This is due to the typically low, and often negative, correlation that bonds exhibit relative to stocks.
As we saw in the previous illustration, while the Global Financial Crisis (GFC) was an excellent example of this diversification benefit, it also led the U.S. Federal Reserve to institute Quantitative Easing (QE). Historically, when economic conditions deteriorate and equity prices fall, bond yields fall, and bond prices rise—hence a negative relationship. However, the massive asset purchases associated with QE suppressed the yields on longer-term Treasurys, leaving little room for this behavior. As a result, QE broke down the historically negative relationship between stocks and bonds.
This shift in correlation can be observed by comparing the returns of the S&P 500 and the ICE BofA 7-10 Year Treasury Index from two periods—one before and one after the inception of QE. The scatterplots from these periods that follow clearly show a dramatic shift from a negative to a positive relationship between the two assets.
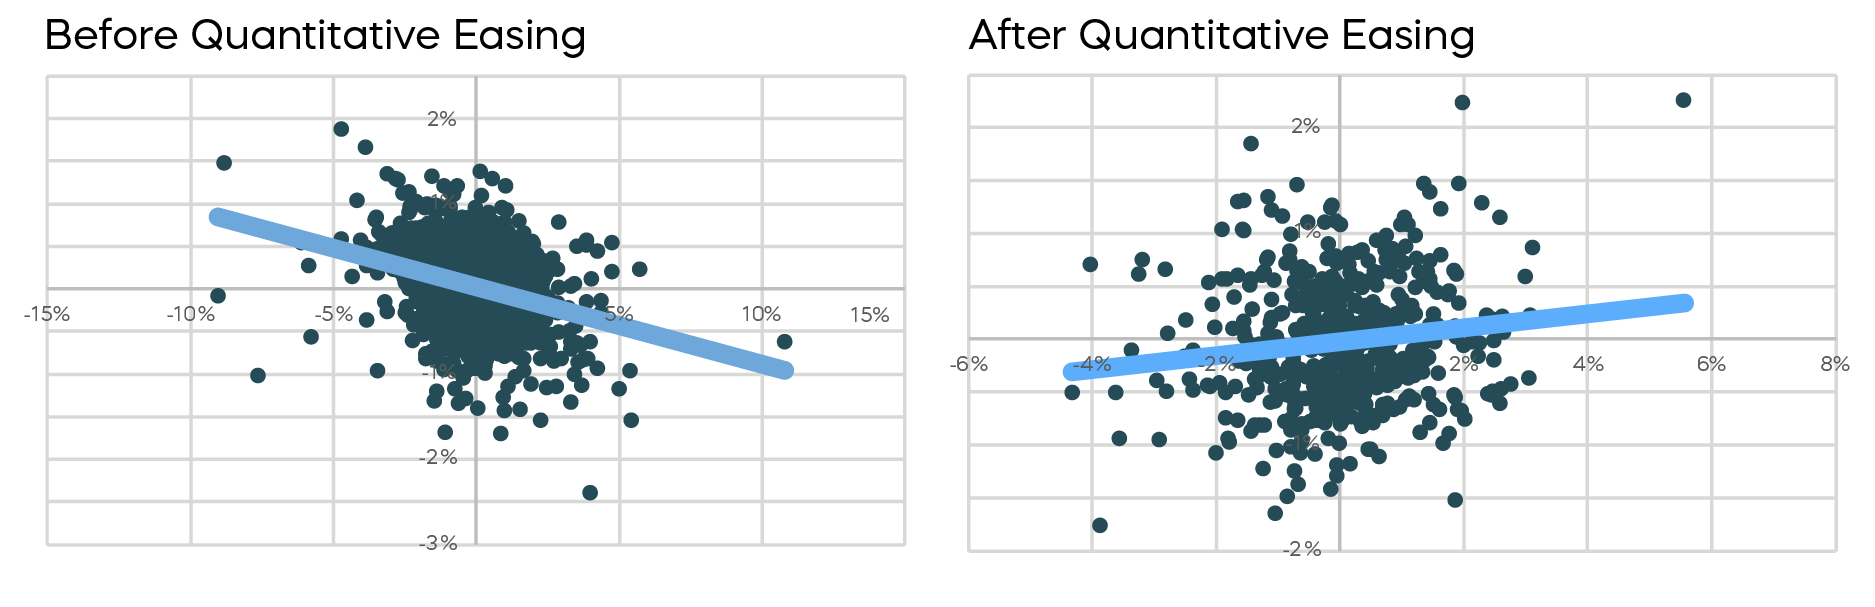
Source: Bloomberg. Data for period before Quantitative Easing is 8/31/99–10/31/08. Data for period after Quantitative Easing is 1/3/22–12/29/23
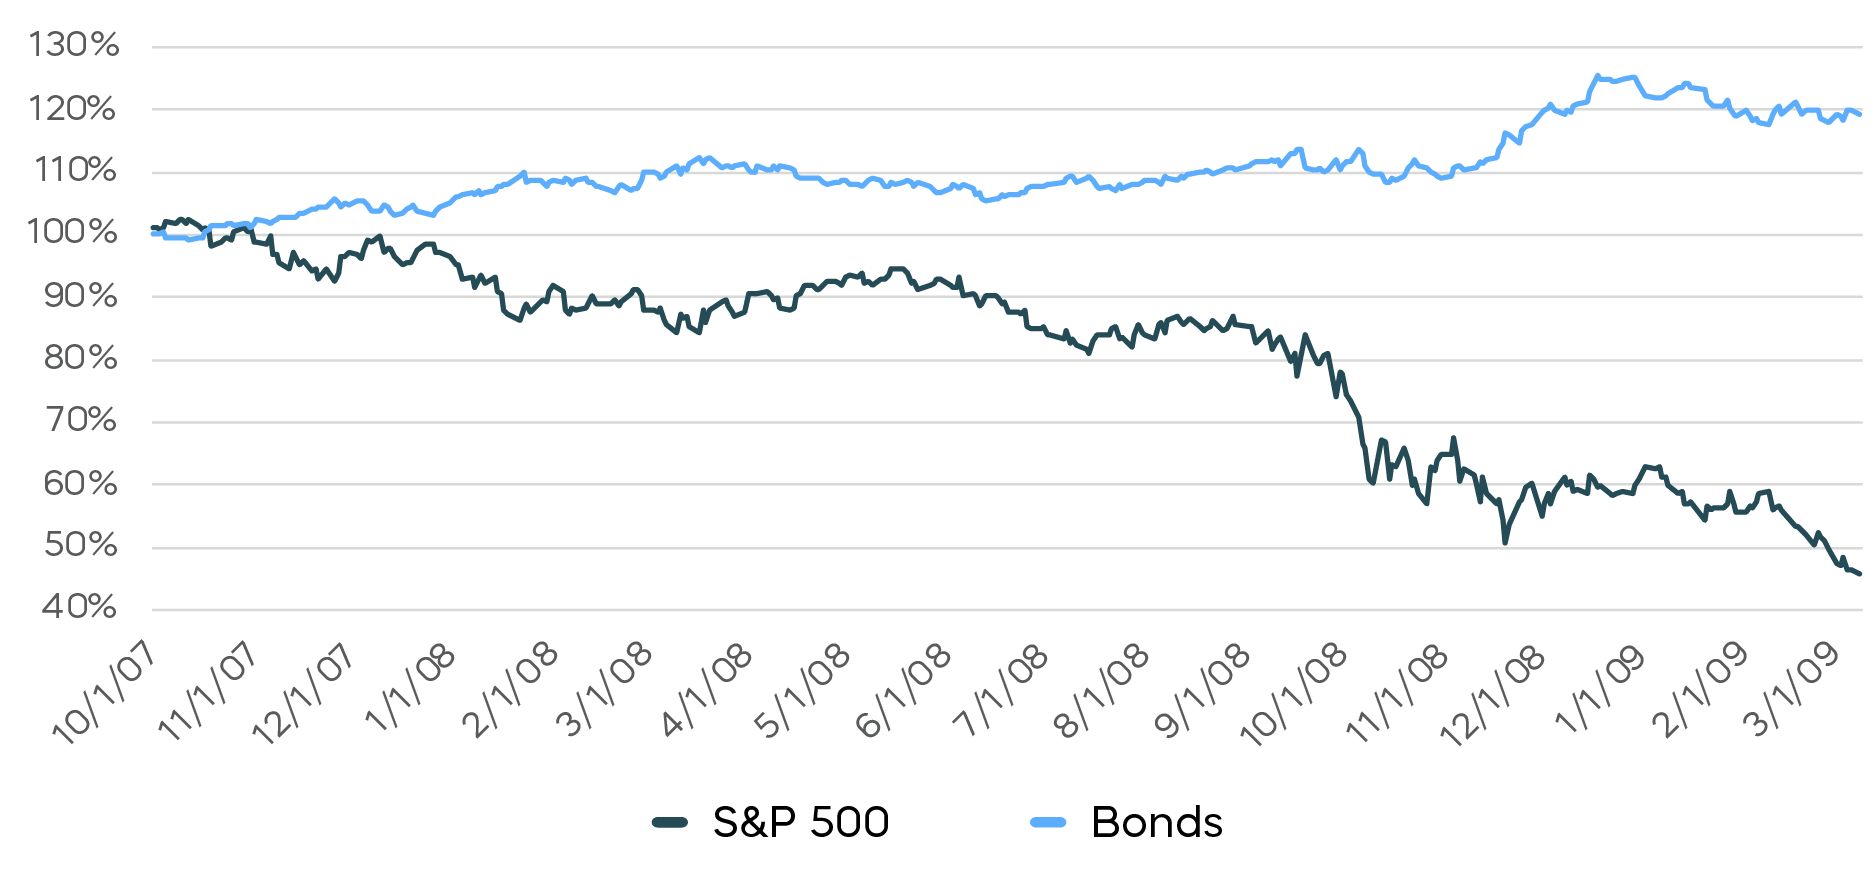
This relationship can be magnified in times of stress. For example, during the GFC (10/1/07–3/9/09), the correlation between the S&P 500 and Treasury Bonds was (-0.42). This was driven by a fall in bond yields. The 10-year Treasury yield fell from 4.59% at the end of September 2007 to a low of 2.25% in December of 2008. While the S&P lost nearly 60% of its value at the trough, the 60/40 portfolio declined by only 33%, significantly cushioning the blow.
In contrast, 2022 stands as a clear example of bonds being "broken" in their ability to diversify stock risk. Due to the lingering effects of QE, the relationship between stocks and bonds shifted, with both asset classes experiencing double-digit losses. The 10-year Treasury yield was 1.63% at the beginning of 2022, leaving it little room to fall, and no room for bond prices to rise. By the end of the period the 10-year Treasury yield had risen to 3.83%. In the chart for 2022, we see that the S&P 500 declined by about 24%, while Treasury Bonds fell by roughly 15%—a clear deviation from what we expect of bonds as a diversifier.
S&P 500 Drawdown vs. Bonds in 2022—"Bonds are Broken"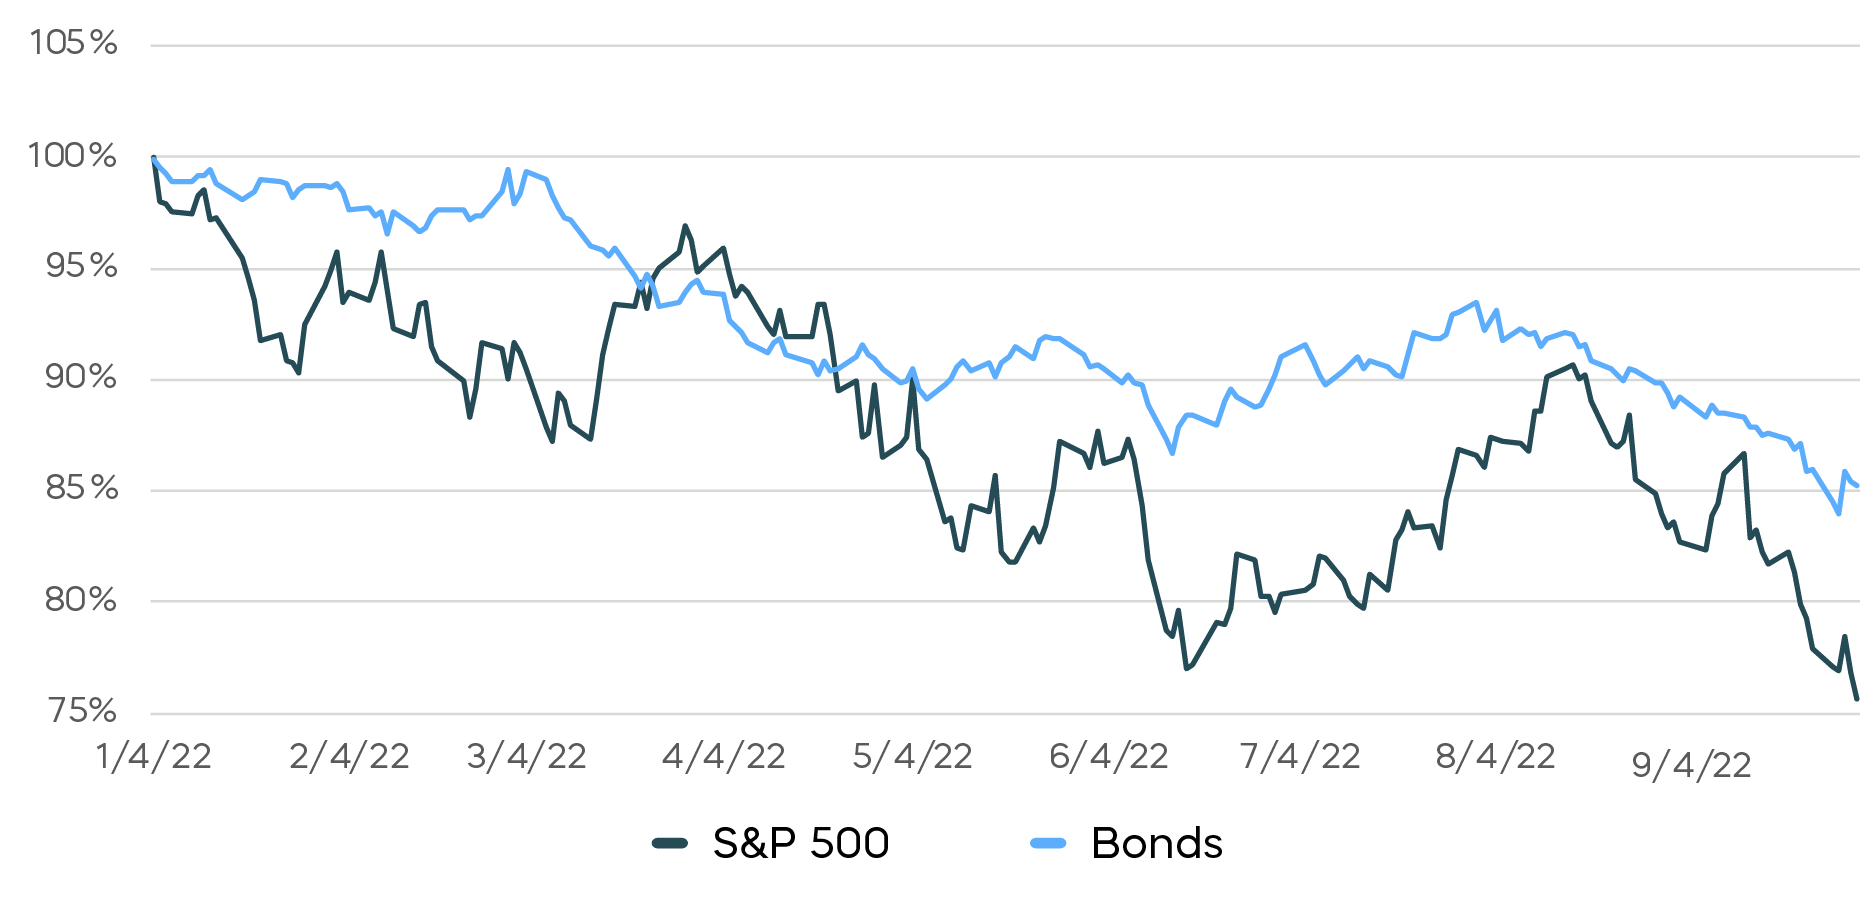
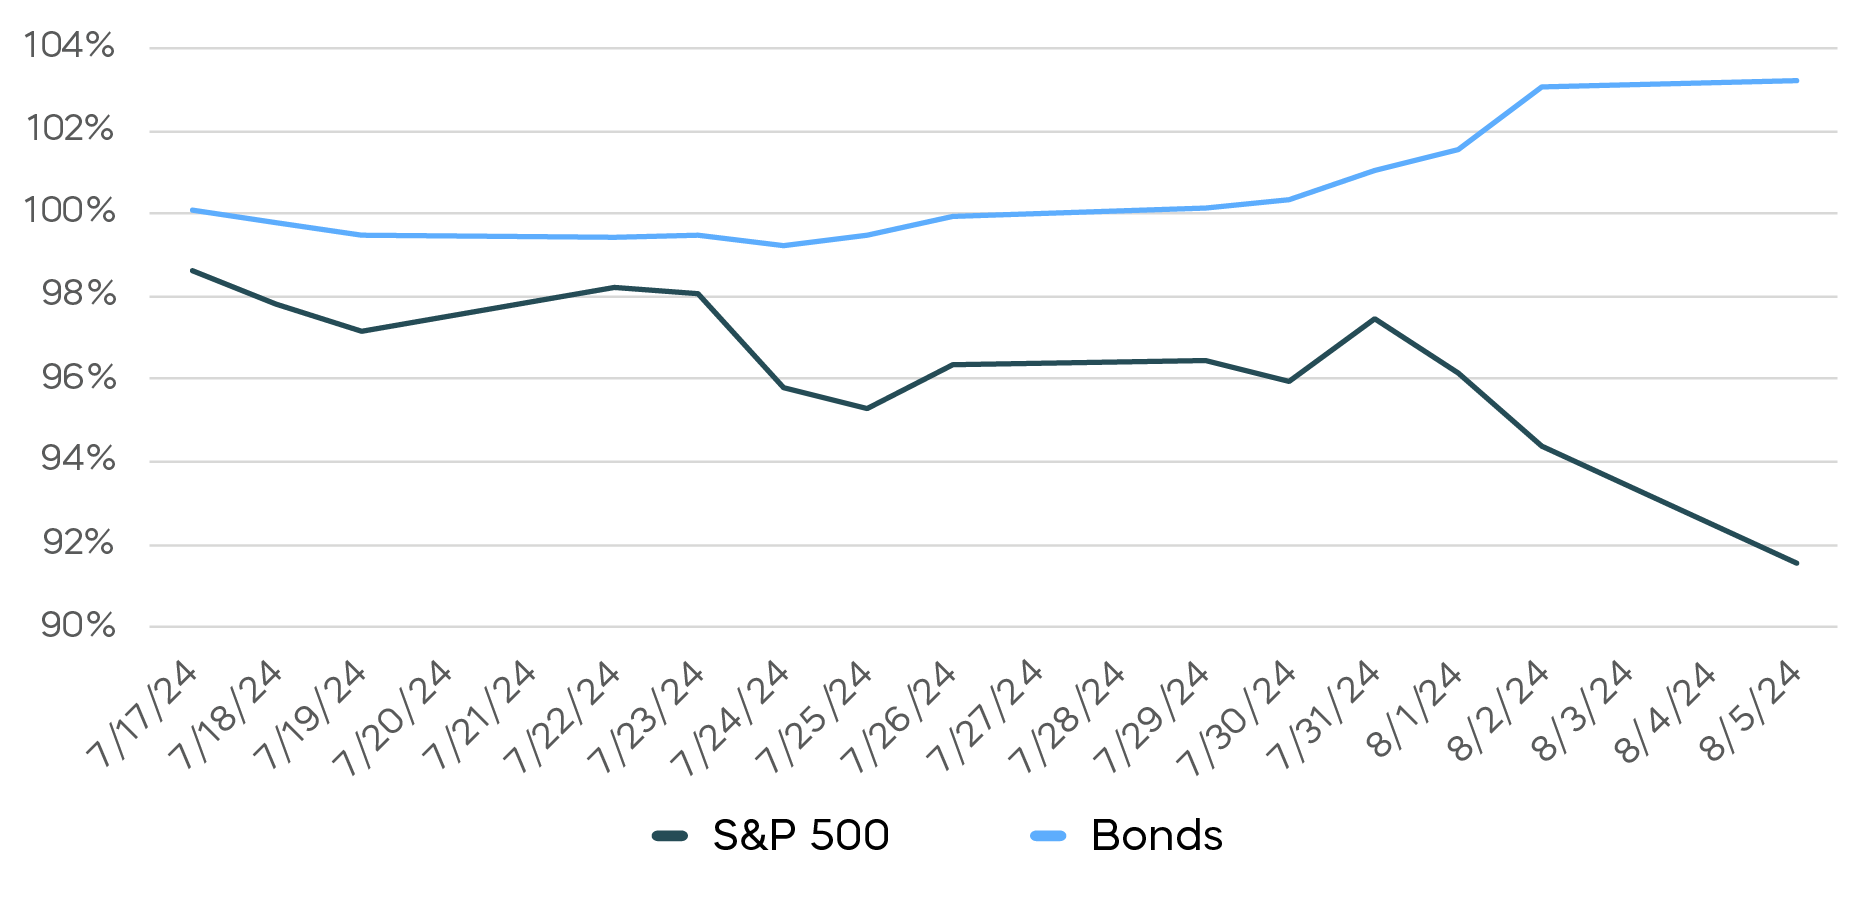
Fortunately, quantitative tightening has gone a long way to normalizing longer-term interest rates, and more recent market behavior suggests that bonds are once again positioned to provide their traditional diversification benefits. In July and August of 2024, the 10-year Treasury yield fell from 4.48% to 3.91%, and while stocks declined by 8.4%, Treasury Bonds rose by 3.2%, signaling a return to the healthy—and 'normal'—negative correlation between the two asset classes.
S&P 500 Drawdown vs. Bonds in July/August 2024—Diversification Normalizing
Simulation
The GFC only happened once. Simulation allows us to repeat the “experiment” of the GFC to gain additional insight into these three portfolios: a 60/40 portfolio, and two "hunch" portfolios—one bond-heavy, and one including covered calls. For Portfolio Two, let’s assume the investor pulled 20% from their stock allocation and added it to bonds, resulting in a 40% stock/60% bond allocation. For Portfolio Three, we assume the investor pulled 10% each from the stock and bond allocations and invested them in a traditional covered call strategy (50/30/20) using BXM.
Using the sample mean returns, volatilities, and correlations from the GFC, we generated 1,000 simulations of each of our three hypothetical portfolios over one year. Note that during the GFC, the correlation between the S&P 500 and BXM was high (0.93), so any expectations of a diversification benefit should be tempered. For each portfolio, we calculate and store the volatility and largest drawdown, resulting in 1,000 values for both metrics.
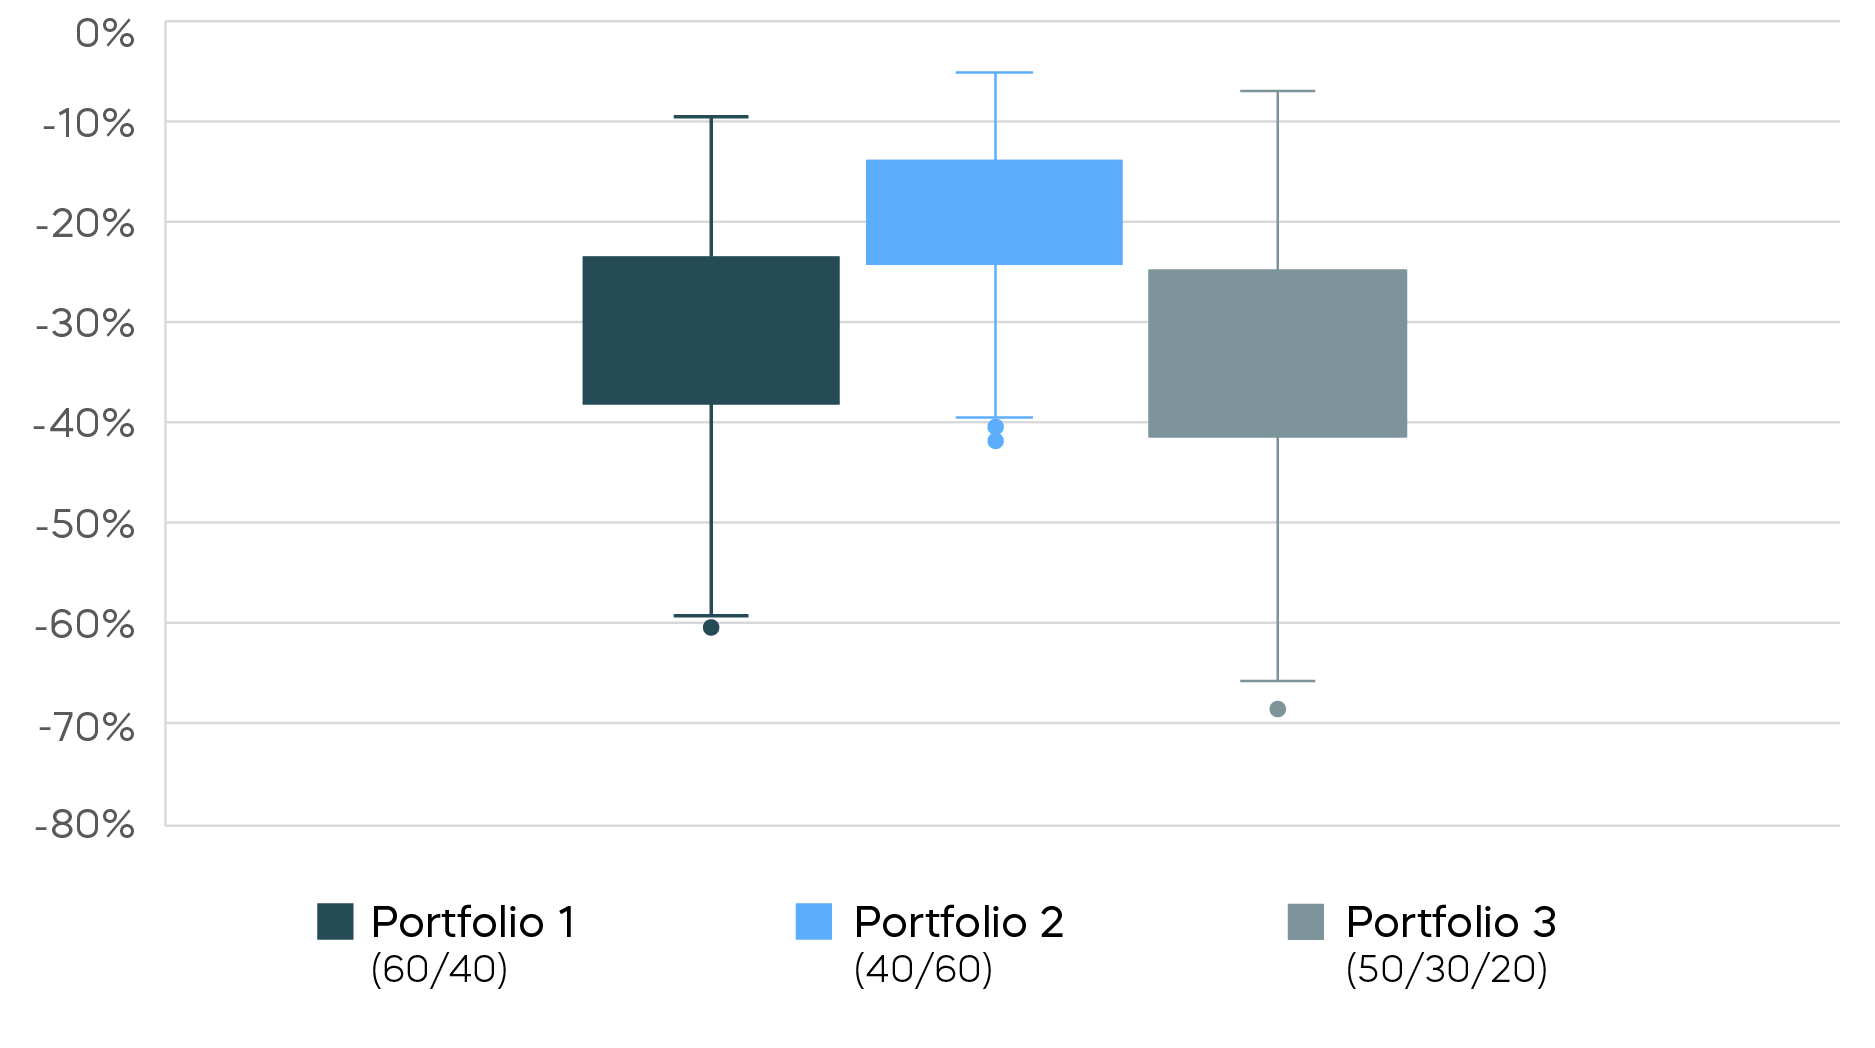
The two boxplot charts that follow show the distributions of the simulated portfolio volatilities and maximum drawdowns for each of the three portfolios. Not only does Portfolio Three have a higher level of volatility, but the drawdowns are larger than those of the standard 60/40 portfolio. The 40/60 portfolio (Portfolio Two) where the investor simply moved more from stocks into bonds, exhibits lower volatility and smaller drawdowns than either of the other two portfolios.
Volatility Distributions of Hypothetical Portfolios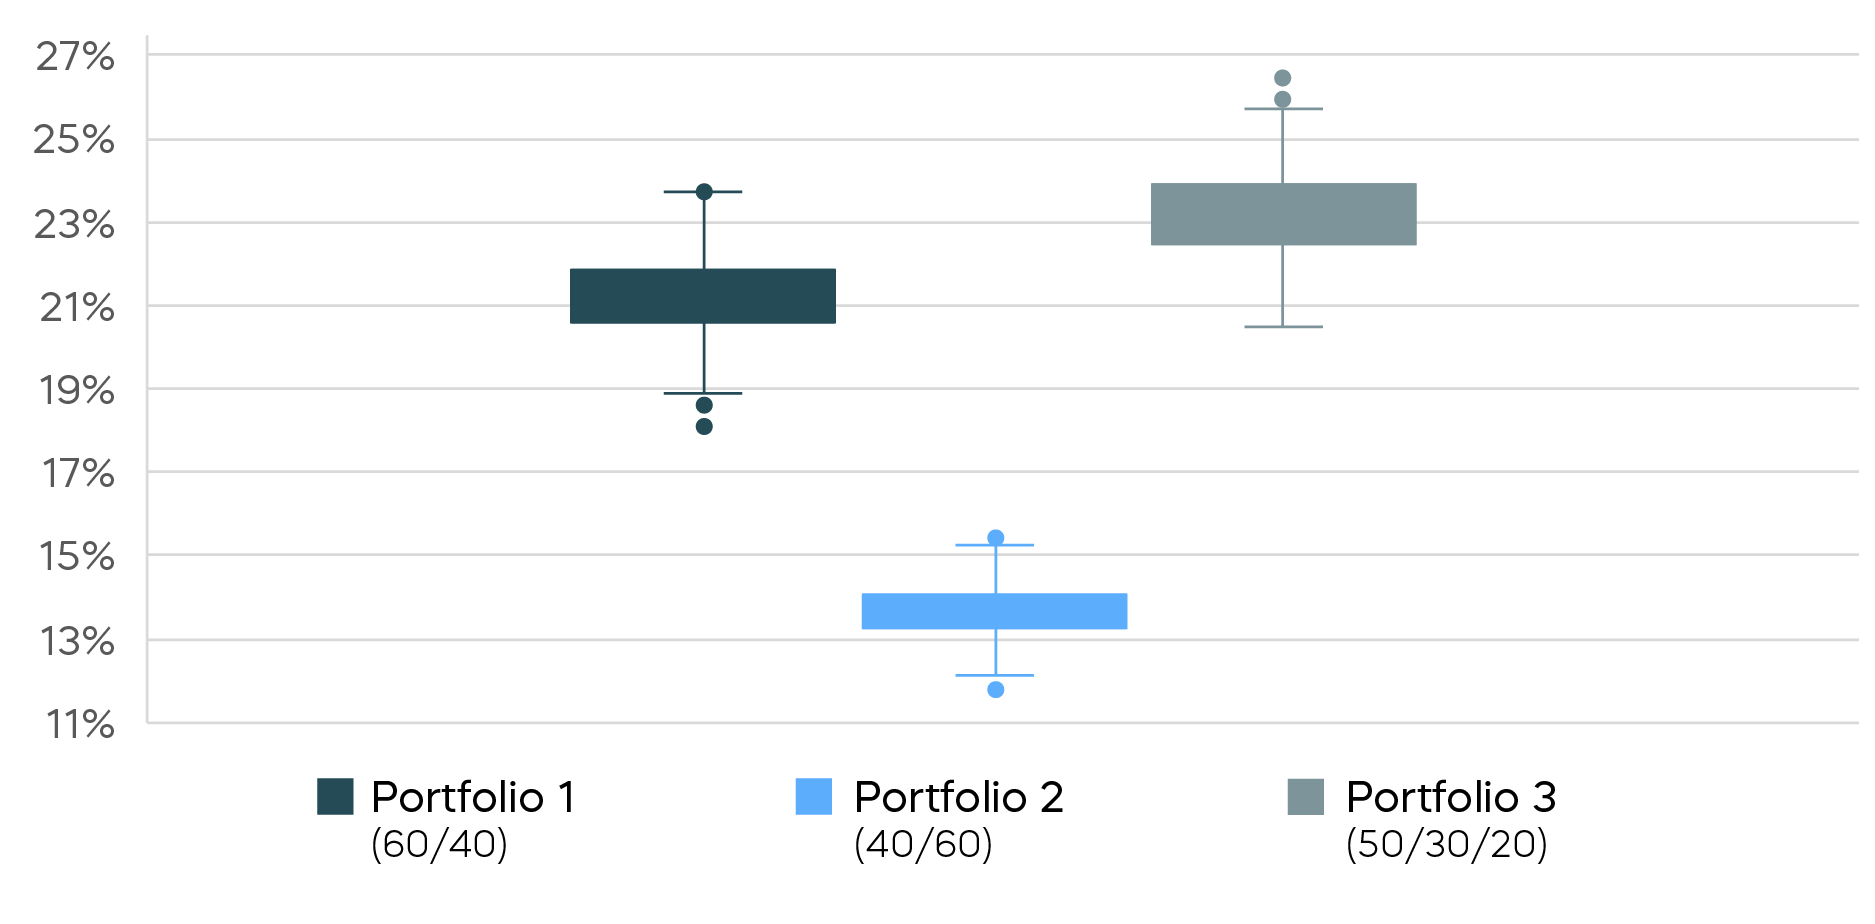
Drawdown Distributions of Hypothetical Portfolios
Investors who believe covered calls provide a "cushion" during market selloffs may wonder why the drawdowns are larger for the portfolio that includes covered calls.
First, the covered call index has similar volatility to the S&P 500 but delivers a much lower total return. It also has a high correlation with the S&P 500, meaning that adding it to a portfolio reduces the expected return without reducing expected volatility—not an ideal combination.
Additionally, consider this scenario for a traditional covered call investor long stocks during a recovery: As we saw in our GFC example, a portfolio including traditional covered calls fell more than the 60/40 portfolio. Unfortunately, when markets rebound, an investor selling monthly covered calls for income purposes effectively caps the amount of upside available as their assets appreciate. In a rapid recovery from a drawdown, when the stock index rebounds quickly, a monthly covered call strategy may significantly lag the standard index on the way back up. At the same time, the covered call strategy also remains exposed to further declines.
In summary, the covered call strategy does not provide a material reduction in risk, whether using volatility or loss reduction as the metric. Looking at the performance statistics for our simulated portfolios, we’ve demonstrated that a 50/30/20 portfolio using monthly covered calls may actually increase both risk and drawdown. Unfortunately, monthly covered calls do not appear to deliver any value as a diversifier for stocks.
Part 3: A Daily Advantage for Covered Calls
The premise of efficacy in asset allocation often comes down to a simple mantra: "Let stocks be stocks, and bonds be bonds." This may pose a challenge for investors who need more income than that default 40% bond allocation can provide. As noted previously, a traditional covered call strategy simply gives up too much, and without a diversification benefit, there is no risk-management utility.
Moreover, the substantial sacrifice of return is likely to prevent the achievement of financial planning goals. A 65-year-old retiree may live 20, 30, or even more years. A 60/40 asset allocation is designed to balance risk with the need for stocks to deliver long-term growth. Placing a portion of one’s stock allocation in a traditional monthly covered call strategy probably won’t get the job done.
It's not wrong to seek additional income from stocks, but the strategy should also meet return and risk expectations that align with equity investments. Unfortunately, with monthly covered calls, we are left with an ambiguous strategy that behaves like neither stocks nor bonds in terms of portfolio construction. While it's true that monthly covered calls can potentially generate substantial income, they generally do not deliver the total return of stocks, nor do they typically provide a significant reduction in risk compared to simply holding a stock index.
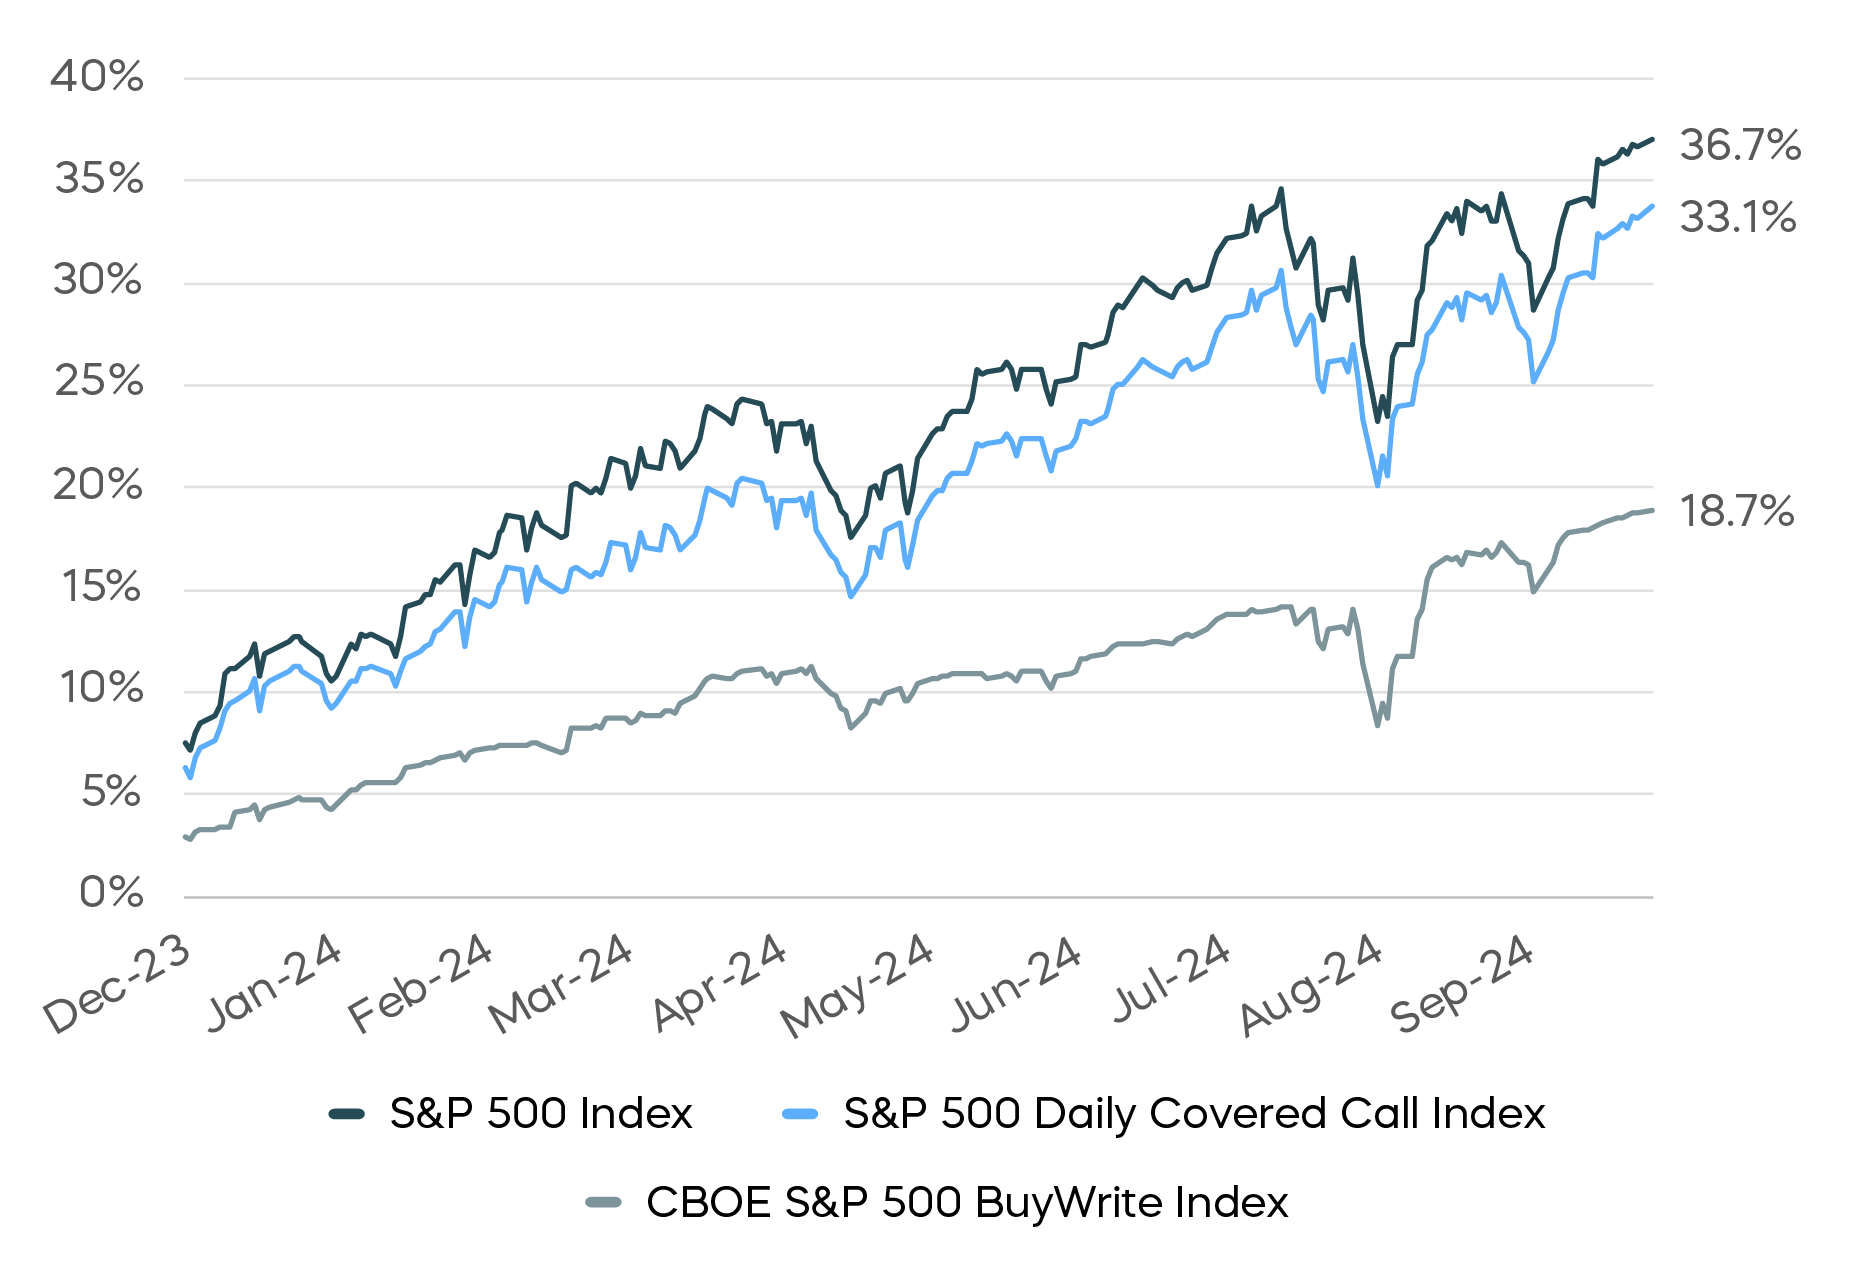
ProShares’ innovative suite of high income daily covered call strategies is designed to address this issue, potentially generating high monthly income, while still delivering equity-like risk and return. For example, the S&P 500 Daily Covered Call Index has delivered 90% of the total return of the S&P 500 since its inception on 10/5/23 through 9/30/24, while generating a double-digit annualized distribution yield (income) for investors. This new approach to equity income allows investors to seek the benefits of equity exposure in their portfolios, while simultaneously targeting a high level of income.
Total Return of S&P 500 vs Monthly and Daily S&P 500 Covered Call Indexes
(Based on Common Inception Date)
The S&P 500 Daily Covered Call Index launched on 10/5/2023. We can test two enhanced versions of a 60/40 portfolio using this brief history to see if daily strategies have the potential to produce measurably different outcomes.
Our enhanced portfolios assume we take 20% out of our S&P 500 allocation to put in either the traditional monthly covered call index (BXM) or the Daily Covered Call Index (DCC). The bond allocation remains the same, so now we have a portfolio allocation of 40/40/20.
During this short period, the portfolio using a covered call strategy based on daily options has already outperformed the portfolio using monthly covered calls by a little more than 3%. While this sample is small, the strategy has performed as designed. Looking at yield, our three portfolios would have had estimated annualized distribution yields of approximately 2.31% for 60/40, and 4% for the 40/40/20 portfolios using BXM or DCC. (Yields were estimated using published data from issuers of ETFs that track the indexes used to construct these portfolios.)
Hypothetical 40/20/20: Monthly (BXM) vs. Daily (DCC) Portfolio Performance
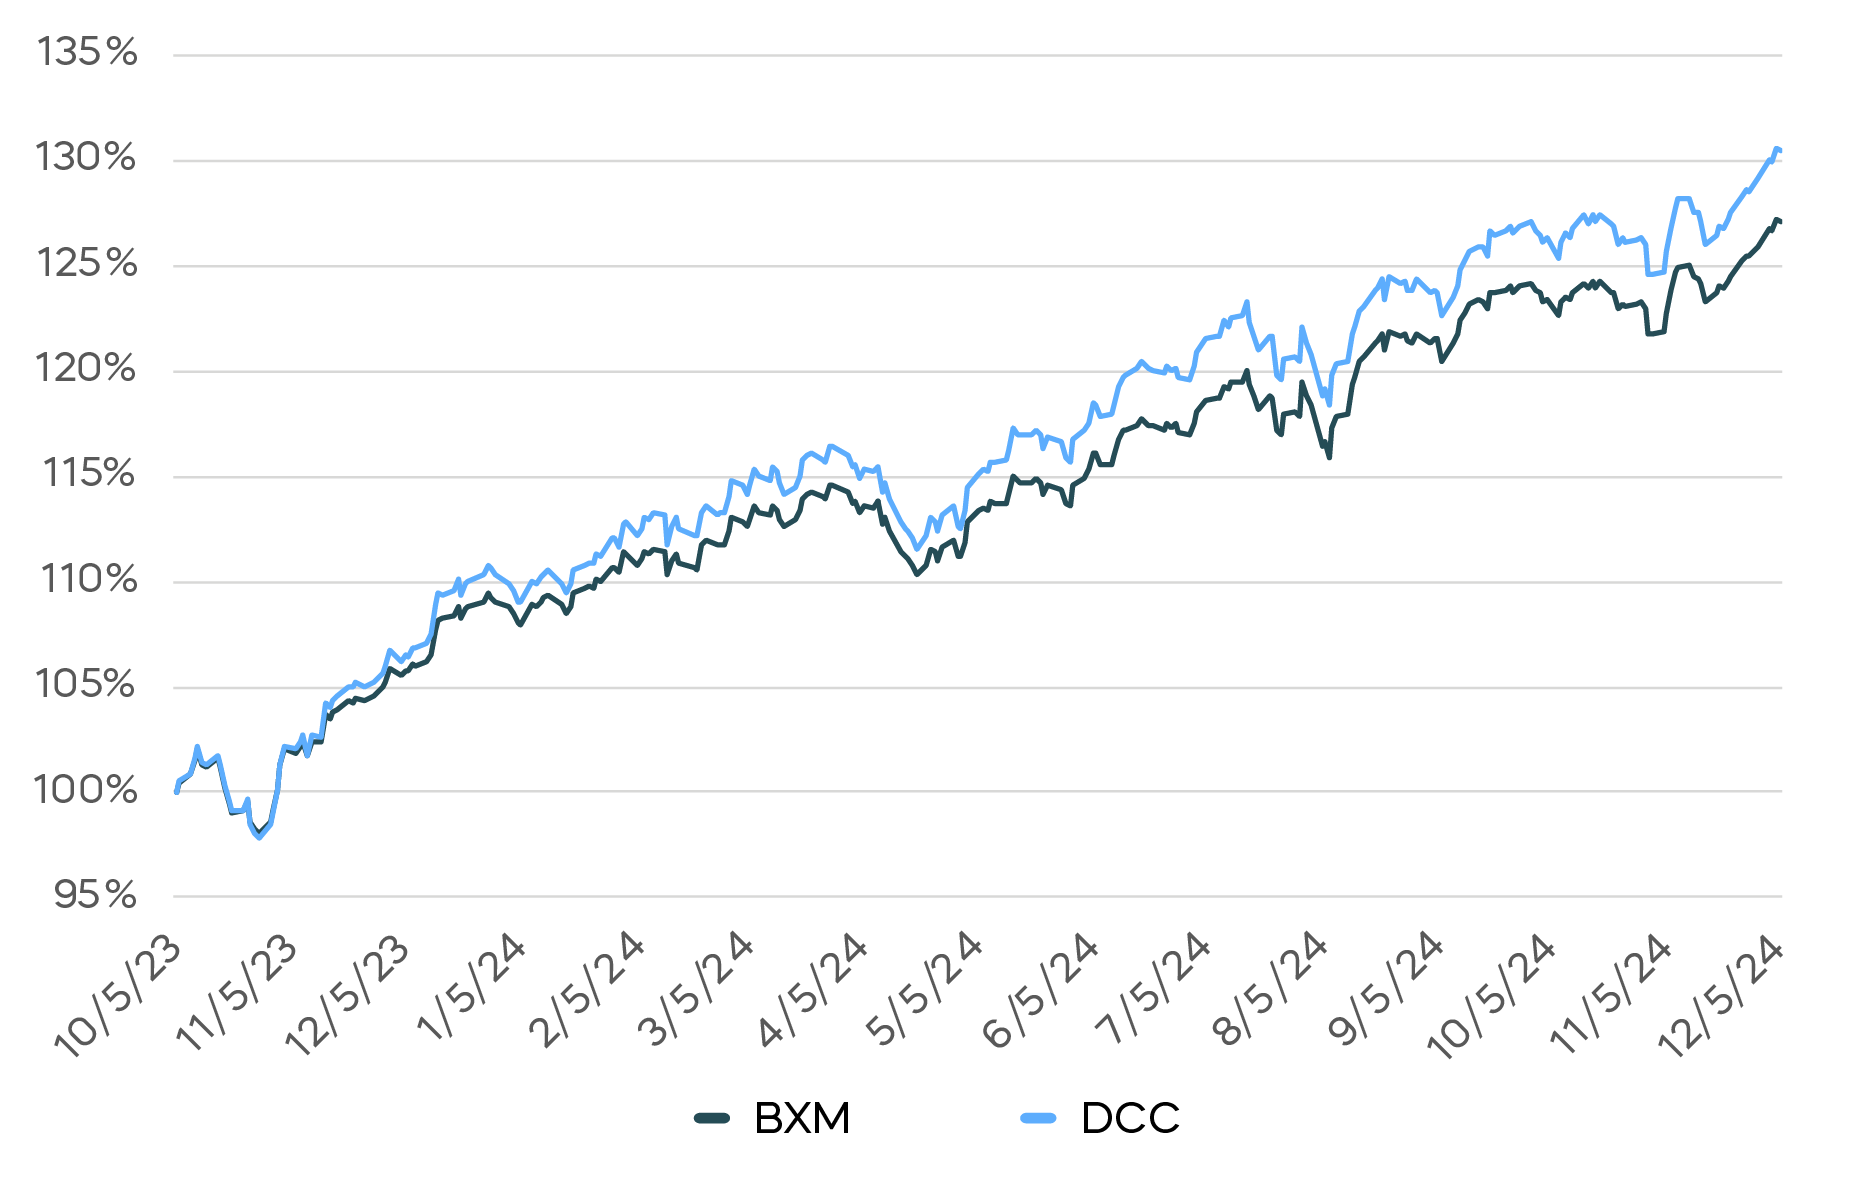
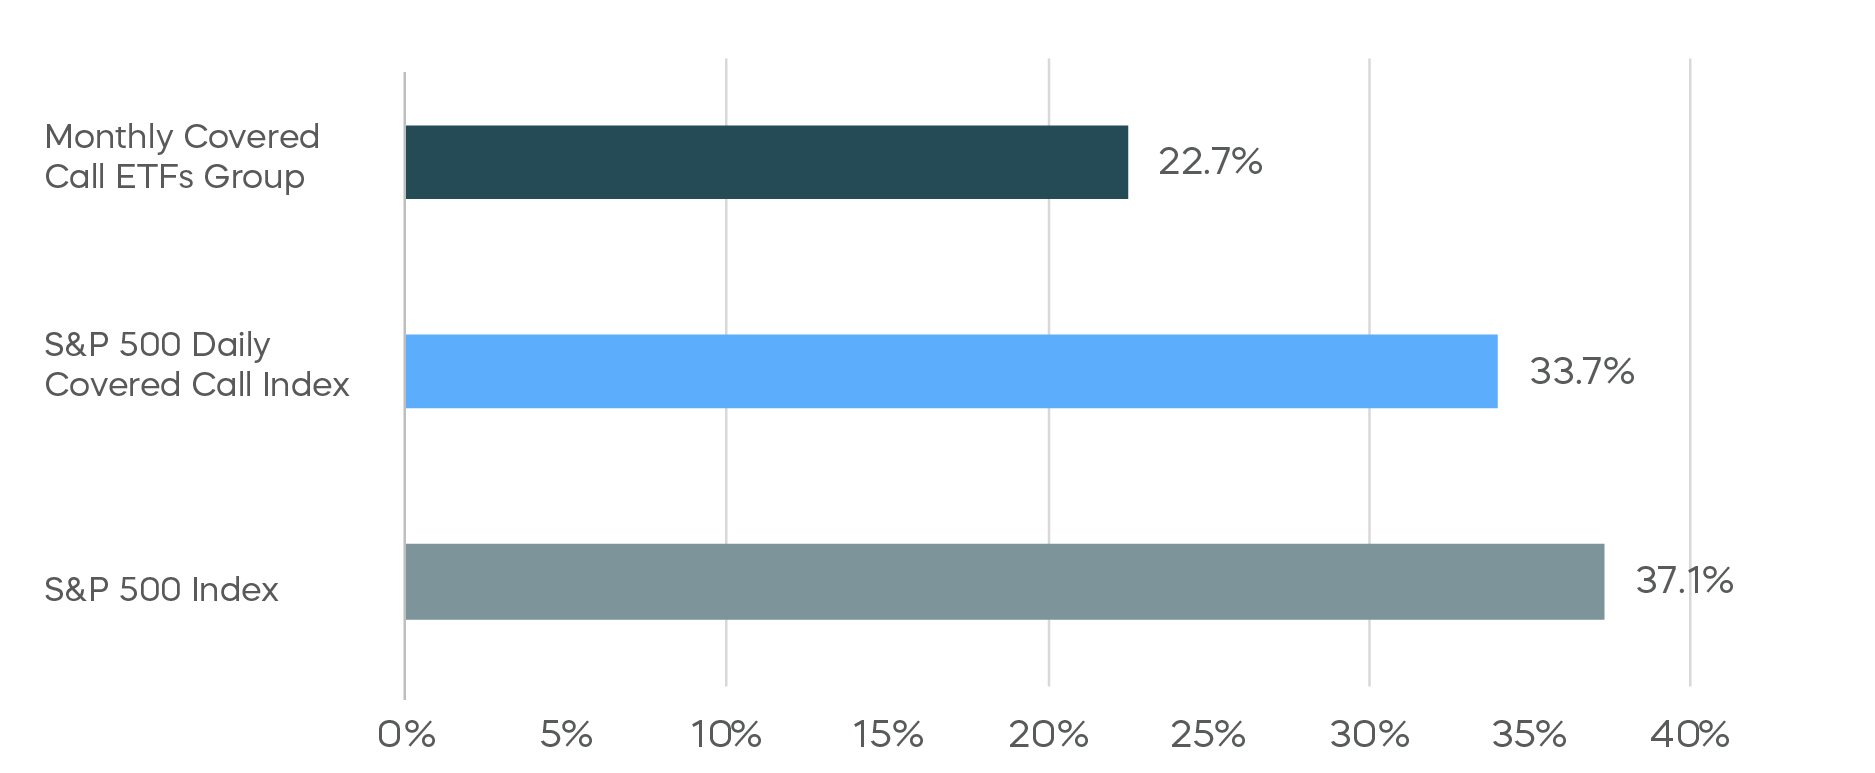
The performance of the covered call strategy using daily options has been strong versus the monthly covered call ETF group as well. From its inception date on 10/5/2023 through 9/30/2024, the S&P 500 Daily Covered Call Index has generated a total return of 33.7%, with an annualized distribution of 11.1%. The monthly covered call ETFs’ group average generated a total return of only 22.7%, with an average trailing 12-month yield of 7.4%.
Performance of Daily Covered Call Index vs. Monthly Peers
(Based on Common Inception Date)
The Daily Covered Call strategy offers a significant innovation in equity income generation, potentially addressing the limitations of traditional monthly covered calls. While the data sample is still small, early results suggest that the S&P 500 Daily Covered Call Index can provide superior performance compared to both traditional covered call strategies and broader peer groups, offering investors a compelling alternative for income generation and portfolio diversification.
Conclusion
In this article, we have demonstrated how bonds have historically provided and can continue to provide true diversification to equity portfolios. We have also shown that traditional monthly covered call strategies, while offering income, have not delivered the total return of equities nor provided any significant diversification benefits. However, with the innovative use of daily options in such strategies, investors can now generate substantial income while still capturing more equity-like total returns. By incorporating these approaches, investors have the potential to better balance income generation, total return, and risk management in their portfolios.