Key Observations

With the prospect of rate cuts looming, it may be time for fixed income investors to consider equity-based income solutions.
The economy’s resilience in the face of higher interest rates has been a central theme for some time now. Those looking for a crack in this narrative found a small one at the end of May. U.S. pending home sales fell 7.7% in April, to the lowest reading since the early months of the pandemic. While this single data point hasn’t shifted expectations for Federal Reserve cuts, it is a sign of the economy’s vulnerability to the impact of higher interest rates, and that at least a modest reduction in the Fed Funds Rate could be approaching. Given that falling yields indicate higher prices for bonds, fixed income investors probably find some comfort in this perspective.
This, however, shines a light on a key challenge for income seekers. Investors who have taken advantage of high short-term interest rates should remember that short-term bonds have a low sensitivity to interest rates, so they will benefit little when rates eventually decline. What’s left for investors in short-term bonds is the need to reinvest at ultimately lower interest rates.
Why not just invest in longer-term bonds and make some money when the Fed eventually cuts rates? As we’ve discussed in previous monthly commentaries, since longer-term interest rates have been liberated from the impact of quantitative easing, they won’t necessarily come down when the Fed cuts its rate. In fact, so far this year, the Bloomberg Aggregate Bond Index is modestly in the red.
This has led many investors to turn to equities to augment their income. The logic is fairly clear—fixed income challenges stem from the fact that bond coupons are generally fixed, while stocks can grow their earnings over time. That’s one reason why stocks are so important to long-term investor outcomes, and why equity strategies capable of targeting both income and returns, like covered calls, have become so popular. But not all covered call strategies are created equal.
Chart of the Month
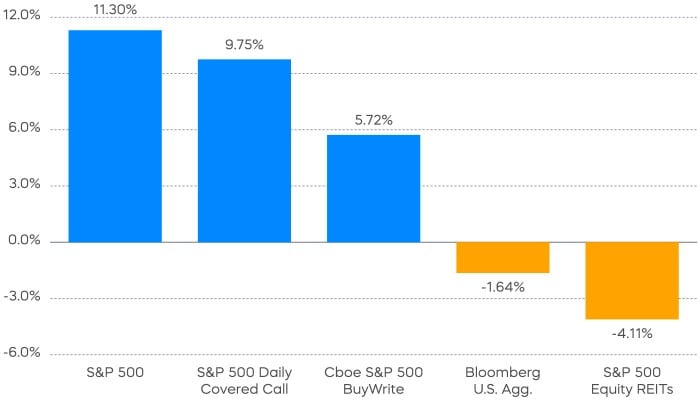
Many equity income approaches have resulted in making equities more bond-like. Witness the underperformance of the real estate sector so far this year —a slice of the equity markets that, like bonds, has historically been vulnerable to high interest rates. Or consider the performance of traditional monthly covered call strategies in 2024. As a tradeoff for the income they have received selling call options, the CBOE Monthly Buy-Write Index has earned only about half of the returns of the S&P 500.
In the quest for equity income, we think it’s more advantageous that your equity investments perform like equities. A recent innovation—daily covered call strategies—can produce both a high level of income and seek to capture the returns that traditional monthly covered call strategies miss out on. Compare the performance of the S&P 500 Daily Covered Call Index to other income strategies this year. Daily covered calls have delivered almost double the return of the CBOE Monthly Buy-Write Index and significantly outpaced both bonds and real estate.
Performance Recap
Large-cap growth stocks led the rebound in risk assets during the month, as Nvidia, Apple, Microsoft, and Alphabet together contributed to more than half of the overall gains in large-cap stocks. Commodities initially continued their bull run but saw some profit taking towards the end of the month after a squeeze took place in the copper market.
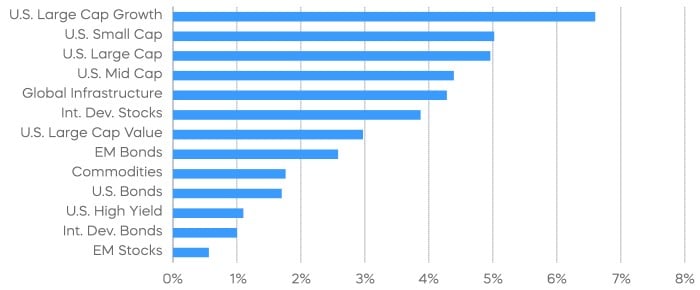
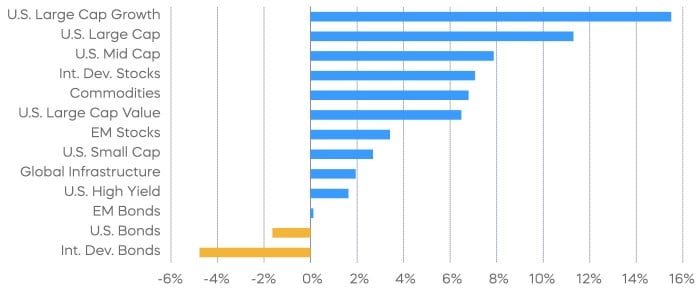
Source: Bloomberg. May returns 5/1/24‒5/31/24; year-to-date returns 1/1/24‒5/31/24. Index returns are for illustrative purposes only and do not reflect any management fees, transaction costs or expenses. Indexes are unmanaged, and one cannot invest directly in an index. Past performance does not guarantee future results.
Economic Calendar

Equity Perspectives

Thin Equity Rally Continues
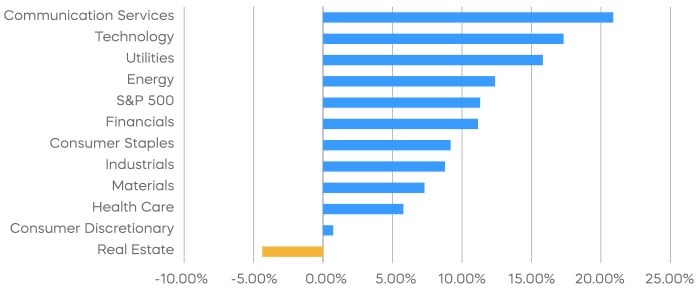
After weakness in April, major stock market indexes returned to positive territory in May, with the S&P 500 posting gains of 5% and touching all-time highs later in the month. Investors hoping for broader participation among S&P 500 companies, however, continued to be disappointed. As we highlighted in our May Commentary, a relatively small number of stocks have been driving the market. Through May, just ten stocks have contributed roughly 70% of the S&P 500’s gains, and only four sectors are beating the S&P 500’s performance on a year-to-date period.
Small pockets of outperformance have left the S&P 500 at historic levels of concentration, and recent price gains with little earnings growth to support them have led to inflated stock prices. This could be a particularly good time for caution as investors begin to consider how much longer the Artificial Intelligence boom will continue.
We think that equal-weighted strategies are a logical alternative in this concentrated environment. By re-weighting the S&P’s 500 stocks in an equal manner rather than by market cap, one can efficiently and immediately reduce concentration and valuation risk. But given concerns over slowing economic growth, is this approach enough? We argue that by combining an equal-weight structure with a focus on quality, investors can achieve potentially better portfolio outcomes.
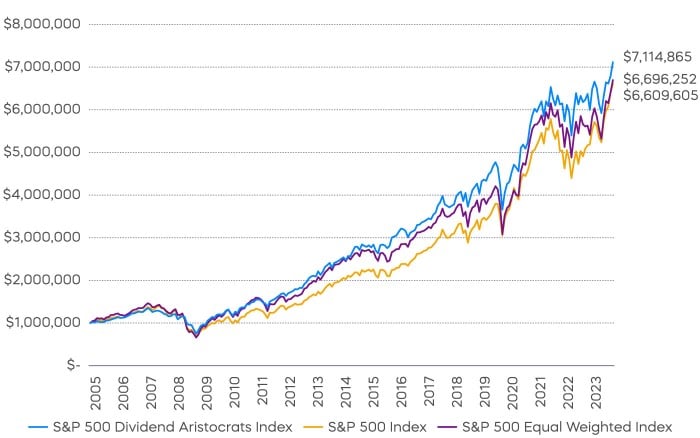
Since its introduction in 2003, the S&P 500 Equal Weight Index has outperformed the cap-weighted S&P 500, and it is within a few basis points of the S&P 500 Growth Index. However, the S&P 500 Equal Weight Index effectively gives a larger weight to smaller, riskier companies, and its outperformance has come at the expense of a higher volatility profile. During periods of market stress, it also typically captures 108% of the downside of the S&P 500.[1]
The S&P 500 Dividend Aristocrats Index may be a higher quality equal-weight alternative. Companies that have consistently grown their dividends typically have a higher quality profile and score better on traditional quality metrics like return-on-assets and return-on-equity. The Aristocrats typically fall about 20% less than the broader S&P 500 during market slides, a key distinction that has helped them outperform the S&P 500 Equal Weight Index and the S&P 500 over time.[2]
Fixed Income Perspectives

Credit spreads remained tight and Treasury yields ended lower on the month despite heavy investment-grade supply and lackluster auction results. April’s core PCE inflation, one of the Fed’s preferred measures of inflation, slowed to 0.2% month-over-month after several months of acceleration earlier this year. U.S. economic readings have generally surprised to the downside this month, increasing support for the case of cutting interest rates this year.
This month, investors could witness a major divergence in central bank policies. While the Federal Reserve has adopted a wait-and-see stance, the European Central Bank (ECB) is widely expected to announce its first rate cut since global central banks began coordinated rate hikes in response to post-pandemic inflation. Pressure is also building on the Bank of Japan (BOJ), which recently ended its negative interest rate policy, to further raise its rates.
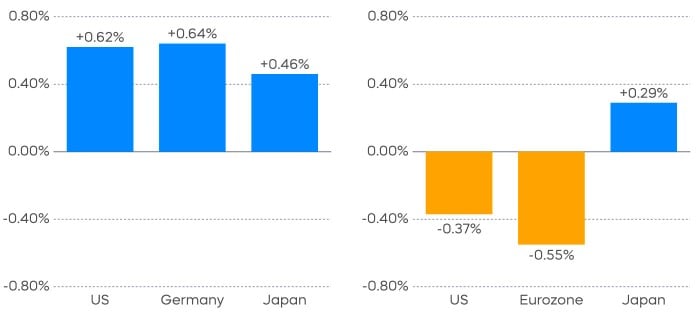
As the chart of implied rate hikes and cuts in 2024 below shows, the U.S. short-term interest rate market is now projecting less than one and a half rate Fed Rate cuts toward the end of the year (-0.37%), contrasting with more than two rate cuts expected from the ECB starting in June (-0.55%). Meanwhile, the market anticipates nearly three 10 basis-point rate hikes from the BOJ this year (+0.29%).
Typically, one would expect such divergent policies to result in global bond yields moving in different directions. However, year to date, long-term bond yields in the United States, Germany and Japan have moved largely in sync. The 10-year Treasury and German Bund yields have increased just over 60 bps, while the 10-year JGB yield has risen by 46 bps.
While different labor conditions could be one potential reason for this unusual pricing action, it does not seem to be the case here. Policymakers often need to balance price pressures with maintaining a healthy labor market, and weakening employment could be taken as a signal to reduce interest rates.
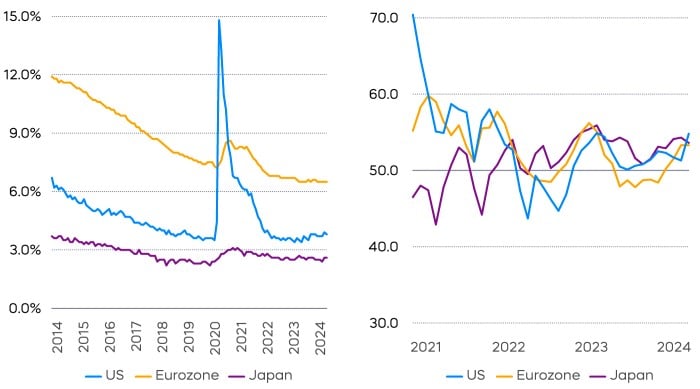
Current unemployment rates remain near pre-pandemic lows in the United States, Germany and Japan, suggesting little urgency for the ECB to reduce its rates compared to other central banks. Additionally, the Service Purchasing Managers’ Index (PMI) across all three of these economies is above 50, which has typically indicated an expansion in economic activities. These Service PMI readings also do not generally support one central bank easing while another tightens simultaneously.
Instead, recent inflation data appears to be the main driver behind Fed and ECB policies. In particular, service inflation in the United States has picked up after trending steadily lower last year, delaying expected rate cuts from the Federal Reserve. In contrast, Eurozone inflation has made more progress toward its target this year, allowing the ECB to begin reducing interest rates.
As outlined in our 2024 Market Outlook, we believe U.S. inflation will continue to trend lower throughout the year. Consequently, long-term bond yields between the U.S. and the Eurozone may continue to move together and the divergence in central bank policies could temper in the coming months, aligning near-term policy actions and reversing some of the euro's losses against the dollar this year.
Meanwhile, much of the pressure on the BOJ to raise interest rates stems from volatility in the currency market, with the Japanese Ministry of Finance intervening to support a "disorderly" depreciating yen. Although policymakers in Japan may bide their time if other central banks adopt a more hawkish view, we believe the ending of Japan’s negative interest rate policy could ultimately support yen strength in the long run. If the yen stabilizes, the Japanese bond market may provide value for international bond investors.
The different market segments represented in the performance recap charts use the following indexes: U.S. Large Cap: S&P 500 TR; U.S. Large Cap Growth: S&P 500 Growth TR; U.S. Large Cap Value: S&P 500 Value TR; U.S. Mid Cap: S&P Mid Cap TR; U.S. Small Cap: Russell 2000 TR; International Developed Stocks: MSCI Daily TR NET EAFE; Emerging Markets Stocks: MSCI Daily TR Net Emerging Markets; Global Infrastructure: Dow Jones Brookfield Global Infrastructure Composite; Commodities: Bloomberg Commodity TR; U.S. Bonds: Bloomberg U.S. Aggregate; U.S. High Yield: Bloomberg Corporate High Yield; International Developed Bonds: Bloomberg Global Agg ex-USD; Emerging Market Bonds: DBIQ Emerging Markets USD Liquid Balanced.
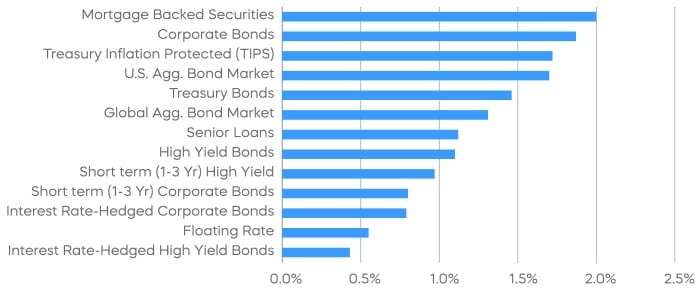
The different market segments represented in the fixed income returns charts use the following indexes: Global Agg Bond Market: Bloomberg Global-Aggregate Total Return Index Value Unhedged USD; Mortgage Backed Securities: Bloomberg U.S. MBS Index Total Return Value Unhedged USD; Treasury Bonds: Bloomberg U.S. Treasury Total Return Unhedged USD; U.S. Agg Bond Market: Bloomberg U.S. Agg Total Return Value Unhedged USD; Corporate Bonds: Bloomberg US Corporate Total Return Value Unhedged USD; High Yield Bonds: Bloomberg U.S. Corporate High Yield Total Return Index Value Unhedged USD; Interest Rate-Hedged High Yield Bonds: FTSE High Yield (Treasury Rate-Hedged) Index; Treasury Inflation Protected (TIPS): Bloomberg U.S. Treasury Inflation Notes TR Index Value Unhedged USD; Short term (1-3 Yr) High Yield: Bloomberg U.S. Corporate 0-3 Year Total Return Index Value Unhedged USD; Senior Loans: Morningstar LSTA U.S. Leveraged Loan 100 Index; Short term (1-3 Yr) Corp Bonds: Bloomberg U.S. Corporate 1-3 Yr Total Return Index Value Unhedged USD; Floating Rate: Bloomberg U.S. FRN < 5 yrs Total Return Index Value Unhedged USD; Interest Rate-Hedged Corporate Bonds: FTSE Corporate Investment Grade (Treasury Rate-Hedged) Index.
The S&P 500 is a benchmark index published by Standard & Poor's (S&P) representing 500 companies with large-cap market capitalizations. The S&P 500 Dividend Aristocrats Index targets companies that are currently members of the S&P 500 that have increased dividend payments each year for at least 25 years. The S&P 500 Daily Covered Call Index seeks to measure the performance of a long position in the S&P 500 TR and a short position in a standard S&P 500 daily call option, aiming to reflect higher income generation and lower timing risk by using daily options versus monthly options. The CBOE S&P 500 BuyWrite Index is a benchmark designed to show the hypothetical performance of a portfolio that engages in a buy-write strategy using S&P 500 call options. The Bloomberg Aggregate Bond Index or "the Agg" is a broad-based fixed-income index used as a benchmark to measure bond market performance. The S&P 500 Equity REIT Index is designed to measure the performance real estate investment trusts (REITs). THESE ENTITIES AND THEIR AFFILIATES MAKE NO WARRANTIES AND BEAR NO LIABILITY WITH RESPECT TO PROSHARES.
This is not intended to be investment advice. Indexes are unmanaged, and one cannot invest directly in an index. Past performance does not guarantee future results.
Any forward-looking statements herein are based on expectations of ProShare Advisors LLC at this time. Whether or not actual results and developments will conform to ProShare Advisors LLC’s expectations and predictions, however, is subject to a number of risks and uncertainties, including general economic, market and business conditions; changes in laws or regulations or other actions made by governmental authorities or regulatory bodies; and other world economic and political developments. ProShare Advisors LLC undertakes no duty to update or revise any forward-looking statements, whether as a result of new information, future events or otherwise.
Investing involves risk, including the possible loss of principal. This information is not meant to be investment advice.
The “S&P 500®,” “S&P 500® Dividend Aristocrats® Index” and “S&P 500 Daily Covered Call Index" are products of S&P Dow Jones Indices LLC and its affiliates and have been licensed for use by ProShare Advisors LLC. "S&P®" is a registered trademark of Standard & Poor’s Financial Services LLC (“S&P”), and “Dow Jones®" is a registered trademark of Dow Jones Trademark Holdings LLC (“Dow Jones”) and they have been licensed for use by S&P Dow Jones Indices LLC and its affiliates. ProShares ETFs based on these indexes are not sponsored, endorsed, sold or promoted by these entities or their affiliates, and they make no representation regarding the advisability of investing in ProShares ETFs. THESE ENTITIES AND THEIR AFFILIATES MAKE NO WARRANTIES AND BEAR NO LIABILITY WITH RESPECT TO PROSHARES.