Key Observations

April was a tough month, with the S&P 500 falling over 4%. Some pointed to rising geopolitical tensions, uncertainty around corporate earnings, and the path of the Artificial Intelligence productivity boom. But a preponderance of the blame seemed to focus on interest rates.
Many pointed fingers at the Fed and the pushing back of expected interest rate cuts. This time around, it wasn’t just short-term rates driven by the Fed Funds Rate that rose though. Longer-term interest rates rose as well, and it is those longer-term interest rates that typically impact stock prices.
The 10-Year Treasury Yield has risen from a recent low of 3.79% as 2023 wound to close, to 4.68% at the end of April. That’s a substantial move that investors in stocks probably should not ignore, but its impact deserves some context and quantification.
-
A long-term analysis of 10-year Treasury yields against price-to-earnings (P/E) multiples predicts that for every 1% increase in the 10-year Treasury yield, P/E multiples typically decline 0.8.
-
That means, hypothetically, if the S&P 500 was trading at a P/E of 20, a 1% increase in the 10-year Treasury yield would bring its P/E down to 19.2, which would be less than a 5% decline in stock prices.
-
That’s probably less of an impact than most expect. A full 1% increase in the 10-year Treasury yield actually has generally, on average, driven less than a 5% decline in stock prices.
Chart of the Month
If the impact of interest rates on stocks is less than many assume it to be, does that mean the coast is clear no matter what happens with rates now? Not quite. A bigger risk to equities likely comes from their current valuations.
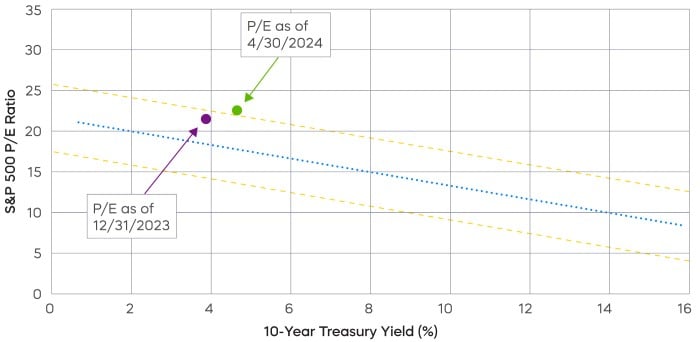
Based on current 10-year Treasury yields, the S&P 500 should have a P/E of about 17.8 on average. As of April 30, the S&P 500’s P/E was 22.6—materially higher than would be expected, and even beyond the bounds of a prediction interval that’s expected to include 68% of the observations.
Can stock valuations “grow” into alignment with that 22.6 P/E? It’s possible, but with roughly 300 of 500 companies reporting so far this earnings season, the 3.5% earnings growth they delivered might not be quite enough.
Is there an alternative for S&P 500 investors with valuations that are better aligned with Treasury yields? The P/E of the S&P 500 Dividend Aristocrats currently stands at 17.9.
Performance Recap
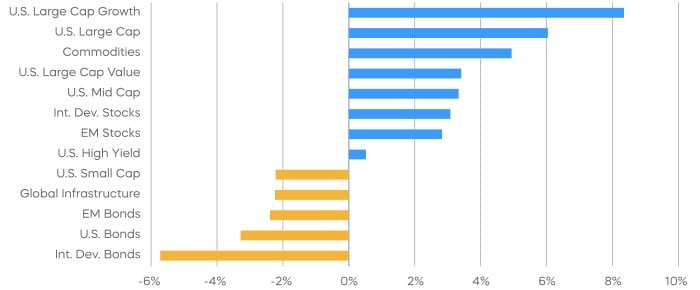
Most risk assets were down during the month of April, as Treasury yields increased in anticipation of delayed rate cuts due to stickier-than-expected inflation prints. Commodities were an exception, as industrial metals gained on favorable supply demand dynamics and recovery in manufacturing activities.

Economic Calendar
Here’s a list of key and upcoming economic releases, which can serve as a guide to potential market indicators.

Equity Perspectives

Narrow market leadership was one of the dominant stock market themes of 2023. The S&P 500 delivered returns of over 26% for the year, but a relatively small group of stocks was responsible for a disproportionately large amount of those returns. Ten stocks delivered 67% of the S&P 500 returns and produced average returns of over 100%. This dynamic left the venerable S&P 500 top-heavy, with the largest 10 names accounting for a record high 31% of total market capitalization.
For the market to advance further in 2024, the thinking went, participation would need to broaden. Exactly the opposite has transpired thus far.
-
Despite the recent pullback, the S&P 500 has delivered a healthy 6% return through April, but concentration levels have become even more extreme.
-
The top 10 stocks, eight of which are carry-overs from 2023, have delivered 83% of the S&P 500 returns thus far. NVIDIA alone accounts for 44% of the S&P 500’s return.

Much of this increase in concentration may be justified by the lights-out earnings that NVIDIA, Amazon, Meta, and Microsoft have continued to deliver. As for the “Other Companies” referenced in the chart above, remember, the S&P 500 delivered no aggregate earnings growth in 2023.
With sticky inflation, slowing GDP growth, and high valuations, we seem to be in a “show-me the earnings” market. We believe stocks that can deliver on the earnings front—especially those with attractive valuations—will more likely be rewarded (eventually), while those unable to deliver on earnings may be punished.
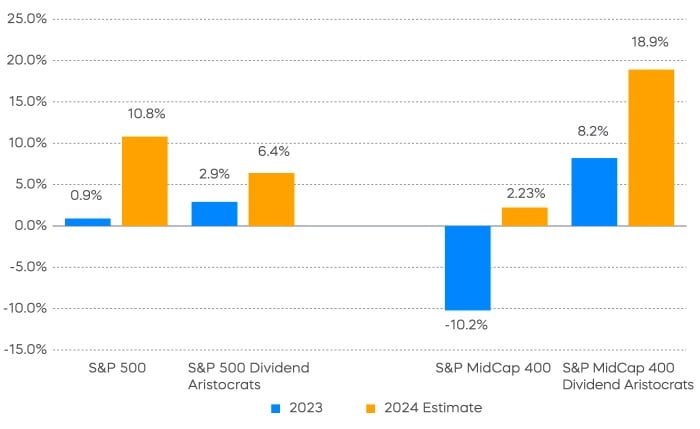
First-quarter earnings season thus far has been delivering on modest expectations, with the S&P 500 expected to deliver 3.5% growth according to FactSet. Full year expectations are for growth of approximately 10.8%, so there is work to be done in the back half of the year. Market reaction to companies reporting earnings has supported the “show-me” sentiment. According to FactSet, the market has been bidding up the stocks of companies that report positive earnings by 1% on average, while those that miss have seen an average decline of 2.5%.
This asymmetric relationship points to a potential opportunity in quality stocks like Dividend Aristocrats. Companies able to deliver a growing dividend to their shareholders over time typically have strong fundamental characteristics, and they’ve historically delivered more consistent levels of earnings growth than the broad market.
The S&P 500 Dividend Aristocrats and the S&P MidCap 400 Dividend Aristocrats each delivered better earnings growth than their market benchmarks in 2023, and seem poised to deliver similar or better growth in 2024.
Potentially more compelling is that both large-cap and mid-cap Dividend Aristocrats have been trading at more attractive valuations relative to the S&P 500 than their broader-market peers. In fact, previous periods when the S&P 500 Dividend Aristocrats have traded at similar valuations compared to the broader S&P 500 have preceded strong periods of future outperformance, which could make today’s valuation levels a potential buy signal. (Source: Bloomberg, based on an analysis of data from 6/30/05–12/31/23.)
Fixed Income Perspectives

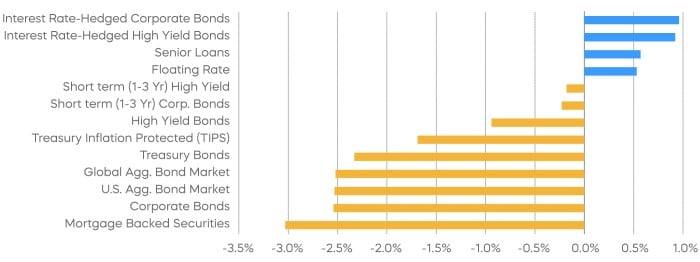
Long-term Treasury yields increased while credit spreads remained at historically tight levels by the end of the month. Interest-rate hedged bonds and floating rate loans posted positive total returns during the month, continuing their year-to-date outperformance.
In its May FOMC meeting, the Federal Reserve acknowledged recent stagnation in its progress towards achieving inflation targets. Specifically, core Personal Consumption Expenditures (PCE) inflation, which is a preferred measure of inflation, increased at an annualized rate of 4.4% during the first three months of 2024, fueled by price increases in durable goods and non-housing services. These developments prompted a shift in market expectations regarding future rate cuts. However, a significant portion of this spike in inflation can be attributed to sharp increases in a few items such as software, banking and investment services, and foreign travel.
Rather than a reversal of the general downtrend in inflation, we see these past three months as part of the bumpy ride towards the final goal. Nevertheless, we think the last mile may prove more challenging, with any reductions in interest rates likely to be more measured and gradual.
The higher-for-longer interest rate environment has weighed on credit fundamentals, as interest coverage ratios[1] have declined since the start of rate hikes, albeit from a relatively high baseline. Despite this, spreads on high yield bonds and leveraged loans have narrowed, accompanied by a decrease in the Cboe Volatility Index (VIX) and a rally in risk assets. Notably, activity in leveraged loans has rebounded from its downturn at the onset of rate hikes in 2022, driven by robust investor demand for floating-rate assets.

Given that credit spreads have tightened across asset classes, we think any further price appreciation may primarily occur in lower-rated credit, where spreads have room for further tightening. Consequently, a key consideration for investors in selecting among credit asset classes should be managing default risks for credits rated CCC or lower, especially if interest rates remain higher for longer.

Both high yield and leveraged loan borrowers have capitalized on investor demand to extend debt that's maturing in the near term. Less than 10% of high yield bond and loan maturities are due in 2024 and 2025. Most of the high yield bond maturities in the near term are rated BB, which typically has stronger fundamentals and access to lower borrowing costs. However, a much larger portion of leveraged loans that face near-term refinancing pressure have lower credit ratings.
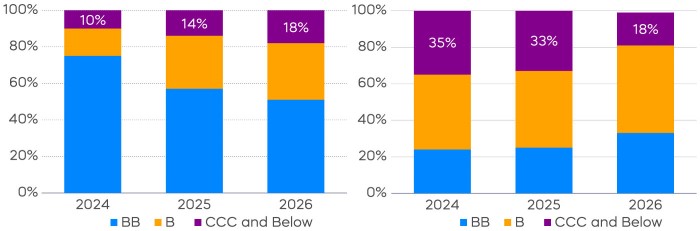
This distribution of near-term maturities reflects both the improvement in high yield credit fundamentals and the deterioration in loan credit fundamentals over recent years. It also highlights the difficulties that the lowest-rated loan borrowers may encounter in extending their debt, even as borrowers engage in various forms of liability management transactions.
While the floating-rate nature of loans reduces interest rate risks for investors, it also increases refinancing risks for borrowers if rates rise, potentially leading to higher default rates. A similar level of interest rate exposure for investors can be achieved through interest rate hedges on bonds with longer durations, allowing access to assets such as high yield bonds, where borrowers are less directly burdened by interest rate fluctuations.
The different market segments represented in the performance recap charts use the following indexes: U.S. Large Cap: S&P 500 TR; U.S. Large Cap Growth: S&P 500 Growth TR; U.S. Large Cap Value: S&P 500 Value TR; U.S. Mid Cap: S&P Mid Cap TR; U.S. Small Cap: Russell 2000 TR; International Developed Stocks: MSCI Daily TR NET EAFE; Emerging Markets Stocks: MSCI Daily TR Net Emerging Markets; Global Infrastructure: Dow Jones Brookfield Global Infrastructure Composite; Commodities: Bloomberg Commodity TR; U.S. Bonds: Bloomberg U.S. Aggregate; U.S. High Yield: Bloomberg Corporate High Yield; International Developed Bonds: Bloomberg Global Agg ex-USD; Emerging Market Bonds: DBIQ Emerging Markets USD Liquid Balanced.
The different market segments represented in the fixed income returns charts use the following indexes: Global Agg Bond Market: Bloomberg Global-Aggregate Total Return Index Value Unhedged USD; Mortgage Backed Securities: Bloomberg U.S. MBS Index Total Return Value Unhedged USD; Treasury Bonds: Bloomberg U.S. Treasury Total Return Unhedged USD; U.S. Agg Bond Market: Bloomberg U.S. Agg Total Return Value Unhedged USD; Corporate Bonds: Bloomberg US Corporate Total Return Value Unhedged USD; High Yield Bonds: Bloomberg U.S. Corporate High Yield Total Return Index Value Unhedged USD; Interest Rate-Hedged High Yield Bonds: FTSE High Yield (Treasury Rate-Hedged) Index; Treasury Inflation Protected (TIPS): Bloomberg U.S. Treasury Inflation Notes TR Index Value Unhedged USD; Short term (1-3 Yr) High Yield: Bloomberg U.S. Corporate 0-3 Year Total Return Index Value Unhedged USD; Senior Loans: Morningstar LSTA U.S. Leveraged Loan 100 Index; Short term (1-3 Yr) Corp Bonds: Bloomberg U.S. Corporate 1-3 Yr Total Return Index Value Unhedged USD; Floating Rate: Bloomberg U.S. FRN < 5 yrs Total Return Index Value Unhedged USD; Interest Rate-Hedged Corporate Bonds: FTSE Corporate Investment Grade (Treasury Rate-Hedged) Index.
The S&P 500 is a benchmark index published by Standard & Poor's (S&P) representing 500 companies with large-cap market capitalizations. The S&P 500 Dividend Aristocrats Index targets companies that are currently members of the S&P 500 that have increased dividend payments each year for at least 25 years. The S&P 400 MidCap Dividend Aristocrats Index targets companies that are currently members of the S&P MidCap 400 that have increased dividend payments each year for at least 15 years. The CBOE Volatility Index (VIX) represents the market’s expectations for volatility over the coming 30 days and is typically used by investors to gauge the level of risk, fear, or stress in the market when making investment decisions. THESE ENTITIES AND THEIR AFFILIATES MAKE NO WARRANTIES AND BEAR NO LIABILITY WITH RESPECT TO PROSHARES.
This is not intended to be investment advice. Indexes are unmanaged, and one cannot invest directly in an index. Past performance does not guarantee future results.
Any forward-looking statements herein are based on expectations of ProShare Advisors LLC at this time. Whether or not actual results and developments will conform to ProShare Advisors LLC’s expectations and predictions, however, is subject to a number of risks and uncertainties, including general economic, market and business conditions; changes in laws or regulations or other actions made by governmental authorities or regulatory bodies; and other world economic and political developments. ProShare Advisors LLC undertakes no duty to update or revise any forward-looking statements, whether as a result of new information, future events or otherwise.
Investing involves risk, including the possible loss of principal. This information is not meant to be investment advice.
The “S&P 500®,” “S&P 500® Dividend Aristocrats® Index” and “S&P MidCap 400® Dividend Aristocrats® Index” are products of S&P Dow Jones Indices LLC and its affiliates and have been licensed for use by ProShare Advisors LLC. "S&P®" is a registered trademark of Standard & Poor’s Financial Services LLC (“S&P”), and “Dow Jones®" is a registered trademark of Dow Jones Trademark Holdings LLC (“Dow Jones”) and they have been licensed for use by S&P Dow Jones Indices LLC and its affiliates. ProShares ETFs based on these indexes are not sponsored, endorsed, sold or promoted by these entities or their affiliates, and they make no representation regarding the advisability of investing in ProShares ETFs. THESE ENTITIES AND THEIR AFFILIATES MAKE NO WARRANTIES AND BEAR NO LIABILITY WITH RESPECT TO PROSHARES.