Key Observations

Surprise! September, typically the worst month for stocks, delivered green across the board, helped by a gift from Fed Chair Powell. A downward trajectory for the Fed Funds rate has historically been bullish for stocks. And with the Personal Consumption Expenditures (PCE) price index1 rising just 0.1% month-over-month, the soft landing appears on track and the case for equities remains strong.
While stock market investors cheered the 50 basis point cut in the Fed Funds rate, fixed income investors received a “salary” cut. And that salary cut is likely to get worse. According to Bloomberg, the two-year U.S. Treasury yield—which follows the market’s anticipated path for the Fed Funds rate—has fallen from roughly 5% last May to just over 3.5% today. This may present a challenge for retirees and other investors who need income.
Investors could choose to shift a portion of their portfolios from stocks to bonds to make up for the income lost to lower interest rates. While that might increase current income in the aggregate, it also risks long-term portfolio growth. Stocks are critical to achieving long-term investment goals, and for many, retirement could span multiple decades.
The good news is that equities can be an important source of both income and growth. Two alternatives, daily covered call and dividend growth strategies, are particularly timely. Think of them as “income now” and “income later.”
Chart of the Month
Third Quarter Performance of Daily Covered Call and Dividend Growth Strategies
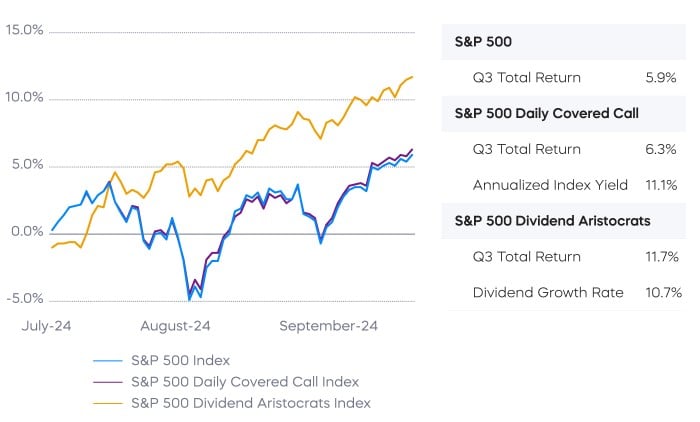
Source: Bloomberg. Performance from 6/28/24–9/30/24. Compound annual growth rate of dividends since 2014. Annualized index yield since inception of the S&P 500 Daily Covered Call Index on 10/4/24. Index returns are for illustrative purposes only and do not reflect any management fees, transaction costs or expenses. Indexes are unmanaged, and one cannot invest directly in an index. Past performance does not guarantee future results.
The performance of dividend growth stocks has turned around recently, driven by quality, valuation, and a timely sector composition. Strategies like the S&P 500 Dividend Aristocrats may be well-positioned to withstand a bit of geopolitical volatility, while taking advantage of the Fed and the U.S. economy. The secret sauce is that double-digit dividend growth is dramatically different over time than a bond’s fixed coupon. While today’s yields may be modest—that “income later”—can be substantial.
For investors who need a more “income now” approach, daily covered call strategies have the potential to deliver both current income and also target full equity returns over time, capturing the returns that traditional monthly covered call strategies sacrifice. Daily covered call strategies present a unique combination of income now and equity growth over the long term. For many investors, it’s an innovation that couldn’t have come at a better time.
Performance Recap
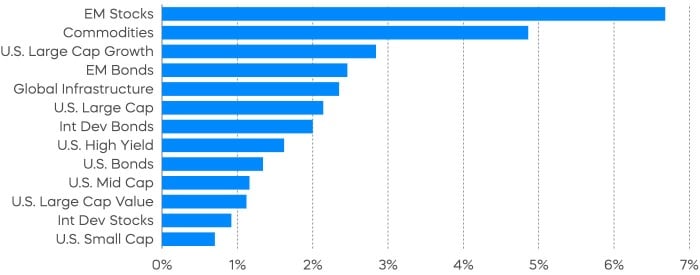
Policymakers in China delivered a series of stimulus measures, including reductions in short-term interest rates and required reserve ratio, new borrowing facility used for stock purchases, and support for the housing market. The MSCI China Index rallied 23% during the month, lifting emerging markets stocks and commodities to become the top-performing asset classes in September.
Asset Class Returns—September 2024
Asset Class Returns—Year to Date
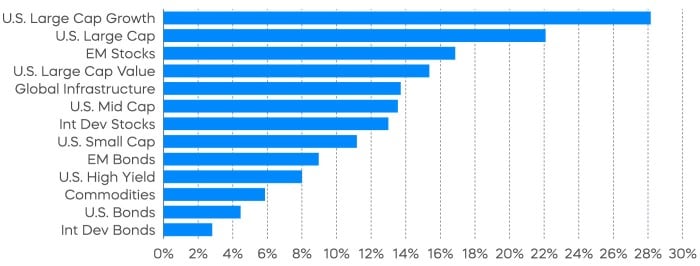
Source: Bloomberg. September returns 9/1/24–9/30/24; year-to-date returns 1/1/24‒9/30/24. Index returns are for illustrative purposes only and do not reflect any management fees, transaction costs or expenses. Indexes are unmanaged, and one cannot invest directly in an index. Past performance does not guarantee future results.
Economic Calendar
Here is a list of key and upcoming economic releases, which can serve as a guide to potential market indicators.
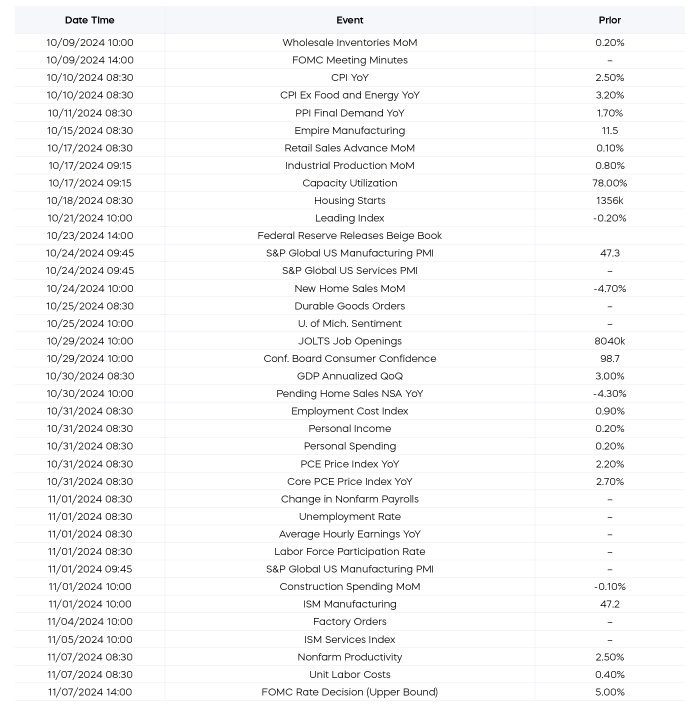
Source: Bloomberg. Data is as of 9/30/24.
Equity Perspectives

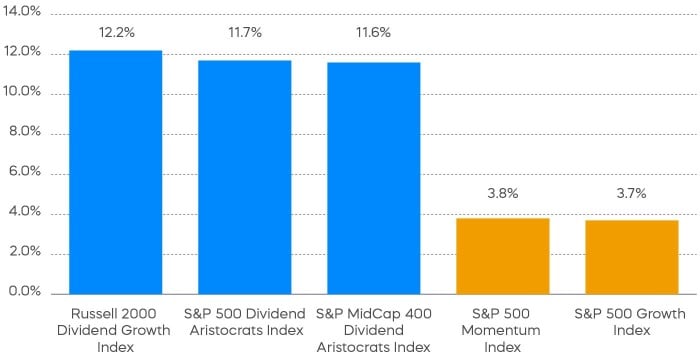
The theme of our Mid-Year Outlook was to focus on a core investing principle that tends to be overlooked in the midst of a bull market: asset allocation. An easy way to generate high returns in the first half of 2024 was to focus on a narrow band of large, growth-oriented stocks, because the Nasdaq-100 Index and the S&P 500 left mid- and small-cap stocks well behind the pace. Skeptics of the rally called for broader participation from other market segments for it to be sustainable. Wish granted. While the S&P 500 delivered another solid quarter with returns of 5.9% for the third quarter, the Russell 2000 Index and the S&P MidCap 400 joined the party and did even better.
Perhaps more notable about third-quarter performance was how factor-based and sector-based leadership changed. Growth and momentum (i.e., technology) stocks suddenly became the laggards after dominating performance since 2023. Utilities and real estate sectors—traditionally known for their ability to produce income—emerged on top, as did dividend strategies across the market cap spectrum.
Source: Morningstar. Data as of 9/30/24. Index returns are for illustrative purposes only and do not represent actual fund performance. Index returns do not reflect any management fees, transaction costs or expenses. Indexes are unmanaged and one cannot invest directly in an index. Past performance does not guarantee future results.
We believe dividend stock leadership will continue. High-quality dividend growth strategies like the Dividend Aristocrats may be well-suited for a market environment that remains favorable, but is dealing with slowing growth and macro uncertainty. The Aristocrats are expected to deliver stronger earnings growth than the broad market over the coming quarters and to continue trading at more attractive valuations. Given their significant underperformance over the past couple of years, a period of outperformance for the Dividend Aristocrats may just be getting started.
The rally in higher-yielding sectors of the equity market like utilities comes at an interesting time for income investors, who just watched the Fed cut short-term rates. The utilities sector’s yield of 3.0% seems attractive relative to current bond yields, and the traditionally defensive sector suddenly has several potential growth drivers, data center electricity demand being a prime example. According to Morningstar, however, the utilities rally dating back to last October has been one of the sector’s largest over the last 20 years, and it could be long in the tooth.
Diversified dividend growth strategies like the S&P 500 Dividend Aristocrats and the S&P MidCap 400 Dividend Aristocrats are a potentially better bet for equity income investors. While offering slightly lower initial yields, Dividend Aristocrats have historically delivered superior levels of dividend growth and total return performance. Over the trailing five-year period, large- and mid-cap Dividend Aristocrats have outperformed utilities stocks on both a nominal and risk-adjusted basis, making them a compelling equity income solution.
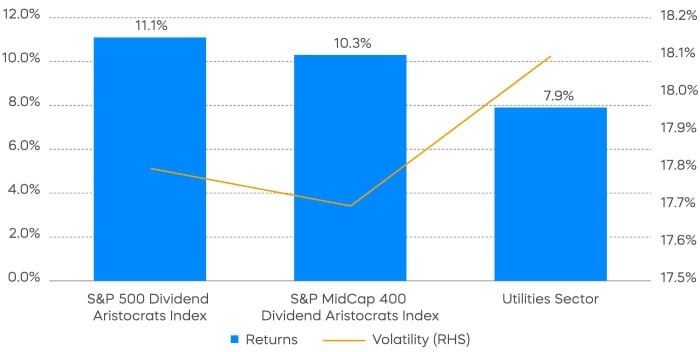
Source: Morningstar. Data as of 9/30/24. Index returns are for illustrative purposes only and do not represent actual fund performance. Index returns do not reflect any management fees, transaction costs or expenses. Indexes are unmanaged and one cannot invest directly in an index. Past performance does not guarantee future results.
Fixed Income Perspectives

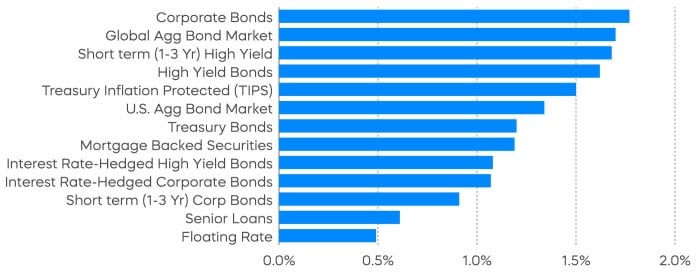
Credit spreads tightened slightly during September and high-grade corporate bonds outperformed. The yield curve steepened as the front end continued to rally after the Federal Reserve cut interest rates for the first time since early 2020. Treasury Inflation Protected Securities (TIPS) also gained as real interest rates declined. Both TIPS and mortgage-backed securities have outperformed Treasurys this year.
At the September FOMC meeting, the Federal Reserve cut interest rates by 50 basis points and signaled that more cuts may follow. Despite the policy makers seeing the current economic condition as appropriate for cutting interest rates, the U.S. is still largely expected to achieve 2% real GDP growth for 2024,2 with the New York Fed Staff Nowcast projecting 3% GDP growth for the third quarter.3 Chairman Powell himself described the economy as “in solid shape,” prompting the question: Why does the Fed maintain an easing bias?
One possible reason is the Fed's delayed shift to accommodative policy compared to other major central banks. While the Fed was relatively early in signaling rate hikes to curb inflation in 2021, it has been slower to cut rates compared to its global counterparts. For instance, the Swiss National Bank, which was three months behind the Fed in raising rates, implemented its first rate cut in March of this year.
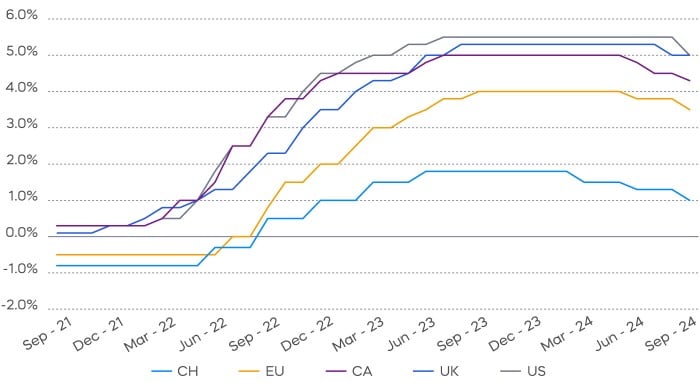
Source: Bloomberg. Data as of 9/30/24.
This discrepancy can be partly attributed to the often-delayed impact of restrictive monetary policy on the U.S. economy. The housing market serves as a prime example: Homeowners with fixed-rate mortgages have been largely insulated from the surge in new mortgage rates. Similarly, this reduced sensitivity to interest rate changes could also temper the effects of monetary easing. As such, the Federal Reserve may feel compelled to return to a more neutral policy stance, recognizing that the impact of previous tightening has yet to be fully realized.
However, what constitutes a neutral interest rate remains a point of debate within the Federal Reserve. At the start of the year, FOMC participants held a wide range of views on longer-run interest rates, and this divergence had only grown more pronounced by the September meeting. A similar number of participants now project median Fed Funds Rates ranging from 2.5% to 3.5%, reflecting their varied perspectives. While we expect that most of the near-term rate cuts priced into the market will materialize, the long-term path for interest rates remains dependent on the health of the economy.
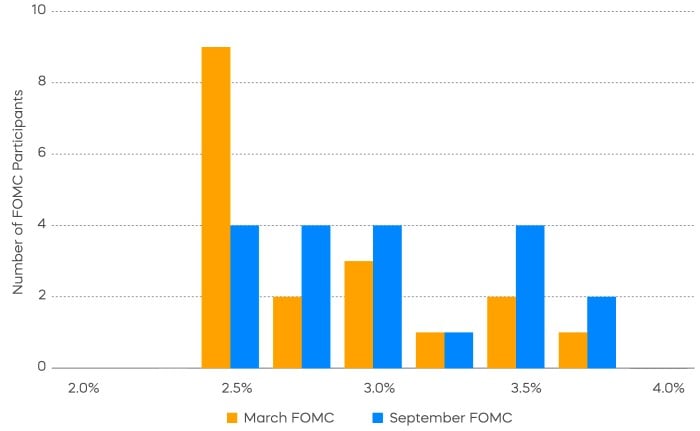
Source: The Federal Reserve, Summary of Economic Projections, March 2024 and September 2024.
We anticipate a gradual economic deceleration, rather than a sharp downturn. The Citi Economic Surprise Index, which slipped into negative territory over the summer as economic results underperformed forecasts, rebounded slightly above zero by the end of September.4 This indicates that economic data may once again be exceeding expectations.
Change in inventories provides further evidence of a measured slowdown, as they typically precede a decline in manufacturing activity by about six months. This gradual inventory buildup suggests a slowing economy, but not one that is headed for an imminent recession. In the absence of a recession, we believe long-term interest rates are likely to remain range bound. Nevertheless, we continue to view duration as an important portfolio diversifier, since an unexpected recession could lead to a decline in long-term interest rates.
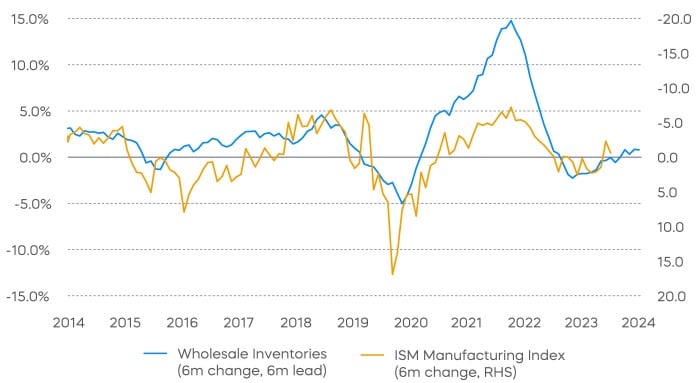
Source: Bloomberg, Data as of 8/31/24.
The different market segments represented in the performance recap charts use the following indexes: U.S. Large Cap: S&P 500 TR; U.S. Large Cap Growth: S&P 500 Growth TR; U.S. Large Cap Value: S&P 500 Value TR; U.S. Mid Cap: S&P Mid Cap TR; U.S. Small Cap: Russell 2000 TR; International Developed Stocks: MSCI Daily TR NET EAFE; Emerging Markets Stocks: MSCI Daily TR Net Emerging Markets; Global Infrastructure: Dow Jones Brookfield Global Infrastructure Composite; Commodities: Bloomberg Commodity TR; U.S. Bonds: Bloomberg U.S. Aggregate; U.S. High Yield: Bloomberg Corporate High Yield; International Developed Bonds: Bloomberg Global Agg ex-USD; Emerging Market Bonds: DBIQ Emerging Markets USD Liquid Balanced.
The different market segments represented in the fixed income returns charts use the following indexes: Global Agg Bond Market: Bloomberg Global-Aggregate Total Return Index Value Unhedged USD; Mortgage Backed Securities: Bloomberg U.S. MBS Index Total Return Value Unhedged USD; Treasury Bonds: Bloomberg U.S. Treasury Total Return Unhedged USD; U.S. Agg Bond Market: Bloomberg U.S. Agg Total Return Value Unhedged USD; Corporate Bonds: Bloomberg US Corporate Total Return Value Unhedged USD; High Yield Bonds: Bloomberg U.S. Corporate High Yield Total Return Index Value Unhedged USD; Interest Rate-Hedged High Yield Bonds: FTSE High Yield (Treasury Rate-Hedged) Index; Treasury Inflation Protected (TIPS): Bloomberg U.S. Treasury Inflation Notes TR Index Value Unhedged USD; Short term (1-3 Yr) High Yield: Bloomberg U.S. Corporate 0-3 Year Total Return Index Value Unhedged USD; Senior Loans: Morningstar LSTA U.S. Leveraged Loan 100 Index; Short term (1-3 Yr) Corp Bonds: Bloomberg U.S. Corporate 1-3 Yr Total Return Index Value Unhedged USD; Floating Rate: Bloomberg U.S. FRN < 5 yrs Total Return Index Value Unhedged USD; Interest Rate-Hedged Corporate Bonds: FTSE Corporate Investment Grade (Treasury Rate-Hedged) Index.
The S&P 500 is a benchmark index published by Standard & Poor's (S&P) representing 500 companies with large-cap market capitalizations. The S&P 500 Daily Covered Call Index seeks to measure the performance of a long position in the S&P 500 TR and a short position in a standard S&P 500 daily call option, aiming to reflect higher income generation and lower timing risk by using daily options versus monthly options. The S&P 500 Dividend Aristocrats Index targets companies that are currently members of the S&P 500 that have increased dividend payments each year for at least 25 years. The S&P MidCap 400 Dividend Aristocrats Index targets companies that are currently members of the S&P MidCap 400 that have increased dividend payments each year for at least 15 years. The S&P 500 Growth Index measures constituents from the S&P 500 that are classified as growth stocks based on three factors: sales growth, the ratio of earnings change to price, and momentum. The S&P 500 Momentum Index measures the performance of securities in the S&P 500 universe that exhibit persistence in their relative performance. The Russell 2000 Index is a small-cap U.S. stock market index that makes up the smallest 2,000 stocks in the Russell Index. The Russell 2000 Dividend Growth Index targets companies that are currently members of the Russell 2000 that have increased dividend payments each year for at least 10 years. The Nasdaq-100 Index includes 100 of the largest domestic and international non-financial companies listed on the NASDAQ Stock Market based on market capitalization. THESE ENTITIES AND THEIR AFFILIATES MAKE NO WARRANTIES AND BEAR NO LIABILITY WITH RESPECT TO PROSHARES.
This is not intended to be investment advice. Indexes are unmanaged, and one cannot invest directly in an index. Past performance does not guarantee future results.
Any forward-looking statements herein are based on expectations of ProShare Advisors LLC at this time. Whether or not actual results and developments will conform to ProShare Advisors LLC’s expectations and predictions, however, is subject to a number of risks and uncertainties, including general economic, market and business conditions; changes in laws or regulations or other actions made by governmental authorities or regulatory bodies; and other world economic and political developments. ProShare Advisors LLC undertakes no duty to update or revise any forward-looking statements, whether as a result of new information, future events or otherwise.
Investing involves risk, including the possible loss of principal. This information is not meant to be investment advice.
The “S&P 500®,” and “S&P 500 Daily Covered Call Index,” ““S&P 500® Dividend Aristocrats® Index” and “S&P MidCap 400® Dividend Aristocrats® Index” are products of S&P Dow Jones Indices LLC and its affiliates and have been licensed for use by ProShare Advisors LLC. "S&P®" is a registered trademark of Standard & Poor’s Financial Services LLC (“S&P”), and “Dow Jones®" is a registered trademark of Dow Jones Trademark Holdings LLC (“Dow Jones”) and they have been licensed for use by S&P Dow Jones Indices LLC and its affiliates. FTSE Russell is a trading name of certain of the LSE Group companies. Nasdaq®, Nasdaq-100 Index®, Nasdaq-100®, NDX®, Nasdaq-100 Daily Covered Call™ Index, NDXDCC™, Nasdaq-100 Daily Covered Call Option™ Index, NDXDCCOV™, Nasdaq-100 Daily Covered Call Income™ Index, NDXDCCI™, are registered trademarks of Nasdaq, Inc. (which with its affiliates and third party licensors is referred to as the “Corporations”) and are licensed for use by ProShare Advisors LLC. ProShares ETFs based on these indexes are not sponsored, endorsed, sold or promoted by these entities or their affiliates, and they make no representation regarding the advisability of investing in ProShares ETFs. THESE ENTITIES AND THEIR AFFILIATES MAKE NO WARRANTIES AND BEAR NO LIABILITY WITH RESPECT TO PROSHARES.