Key Observations

News related to tariffs, DOGE, geopolitical unrest, NVIDIA earnings, and more significantly impacted U.S. stock markets recently, with the S&P 500 retreating over 2.5% during the second half of February. There are signs that meaningful structural shifts are taking place in the market.
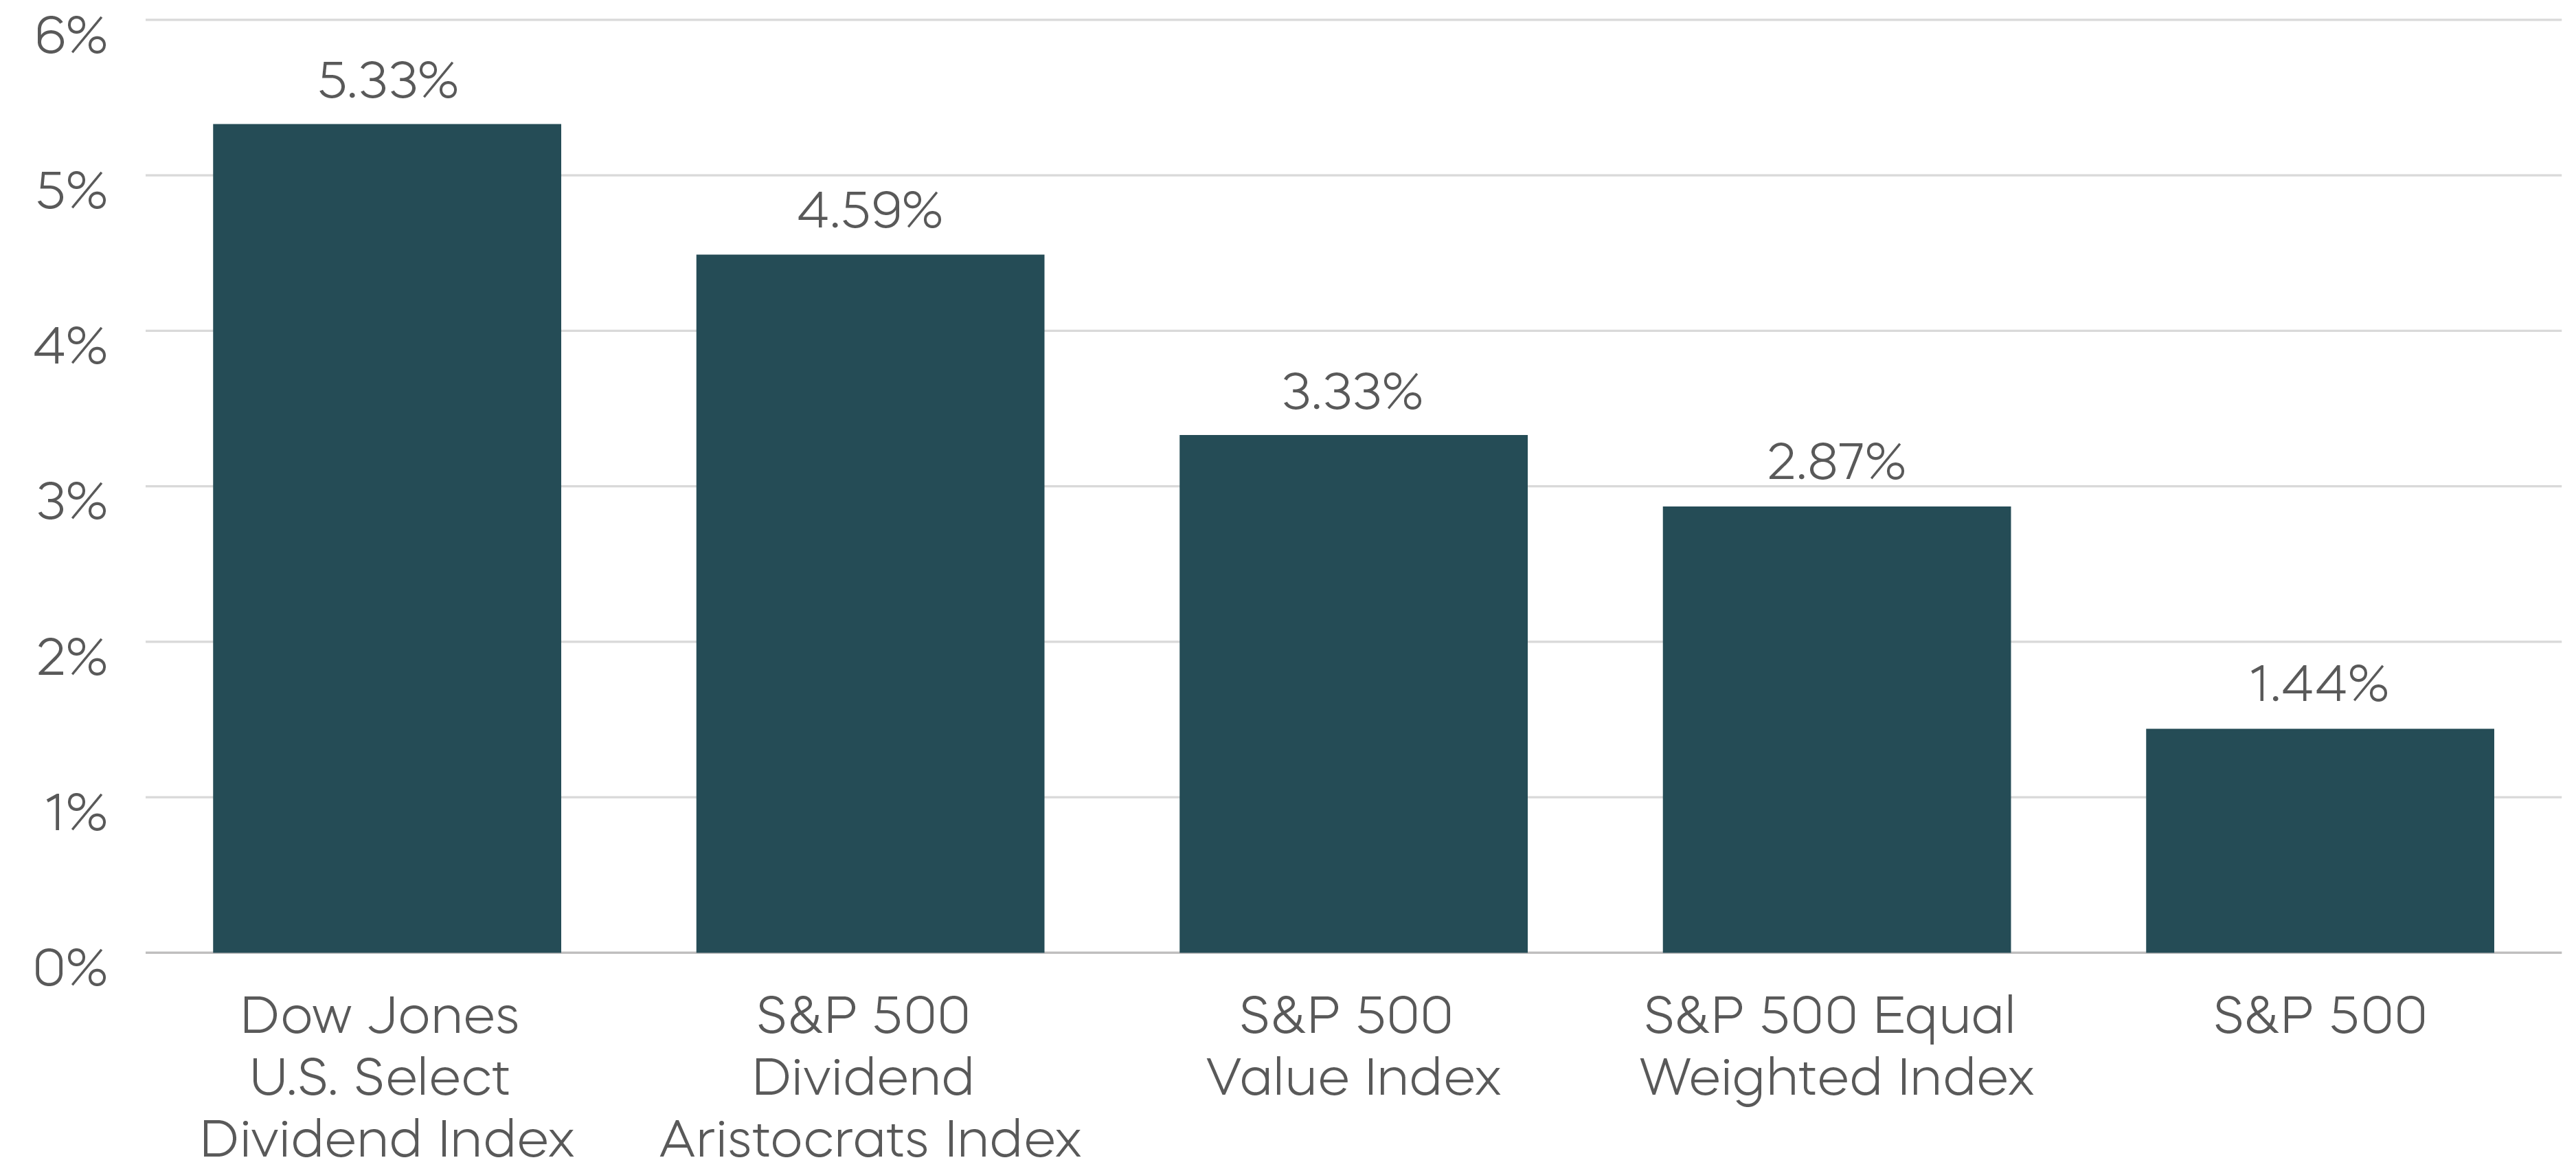
Calls identifying a “great rotation” have grown in frequency and volume. The S&P 500 technology sector fell almost 6% in February, as did the S&P 500 Growth Index, while strategies with limited exposure to the Magnificent 7 and tech generally outperformed. For example, the equally weighted S&P 500, S&P 500 Value Index and the Dow Jones U.S. Select Dividend Index of high dividend yielding stocks have outperformed year to date.
During such turbulent times, a wide variety of stocks that have been left behind may deliver short periods of outperformance. But for investors looking for sustained outperformance potential, companies that maintain strong fundamentals even when their stock prices lag could be a better opportunity—they become quality that’s on sale.
The high-quality dividend growth stocks of the S&P 500 Dividend Aristocrats fit this bill. They have been near the top for year-to-date performance and maintained stronger fundamentals than the S&P 500 as a whole.
Charts of the Month
S&P 500 Dividend Aristocrats Index Total Returns Have Been Strong Year to Date
S&P 500 Dividend Aristocrats Index Return on Assets Reflects Strong Fundamentals
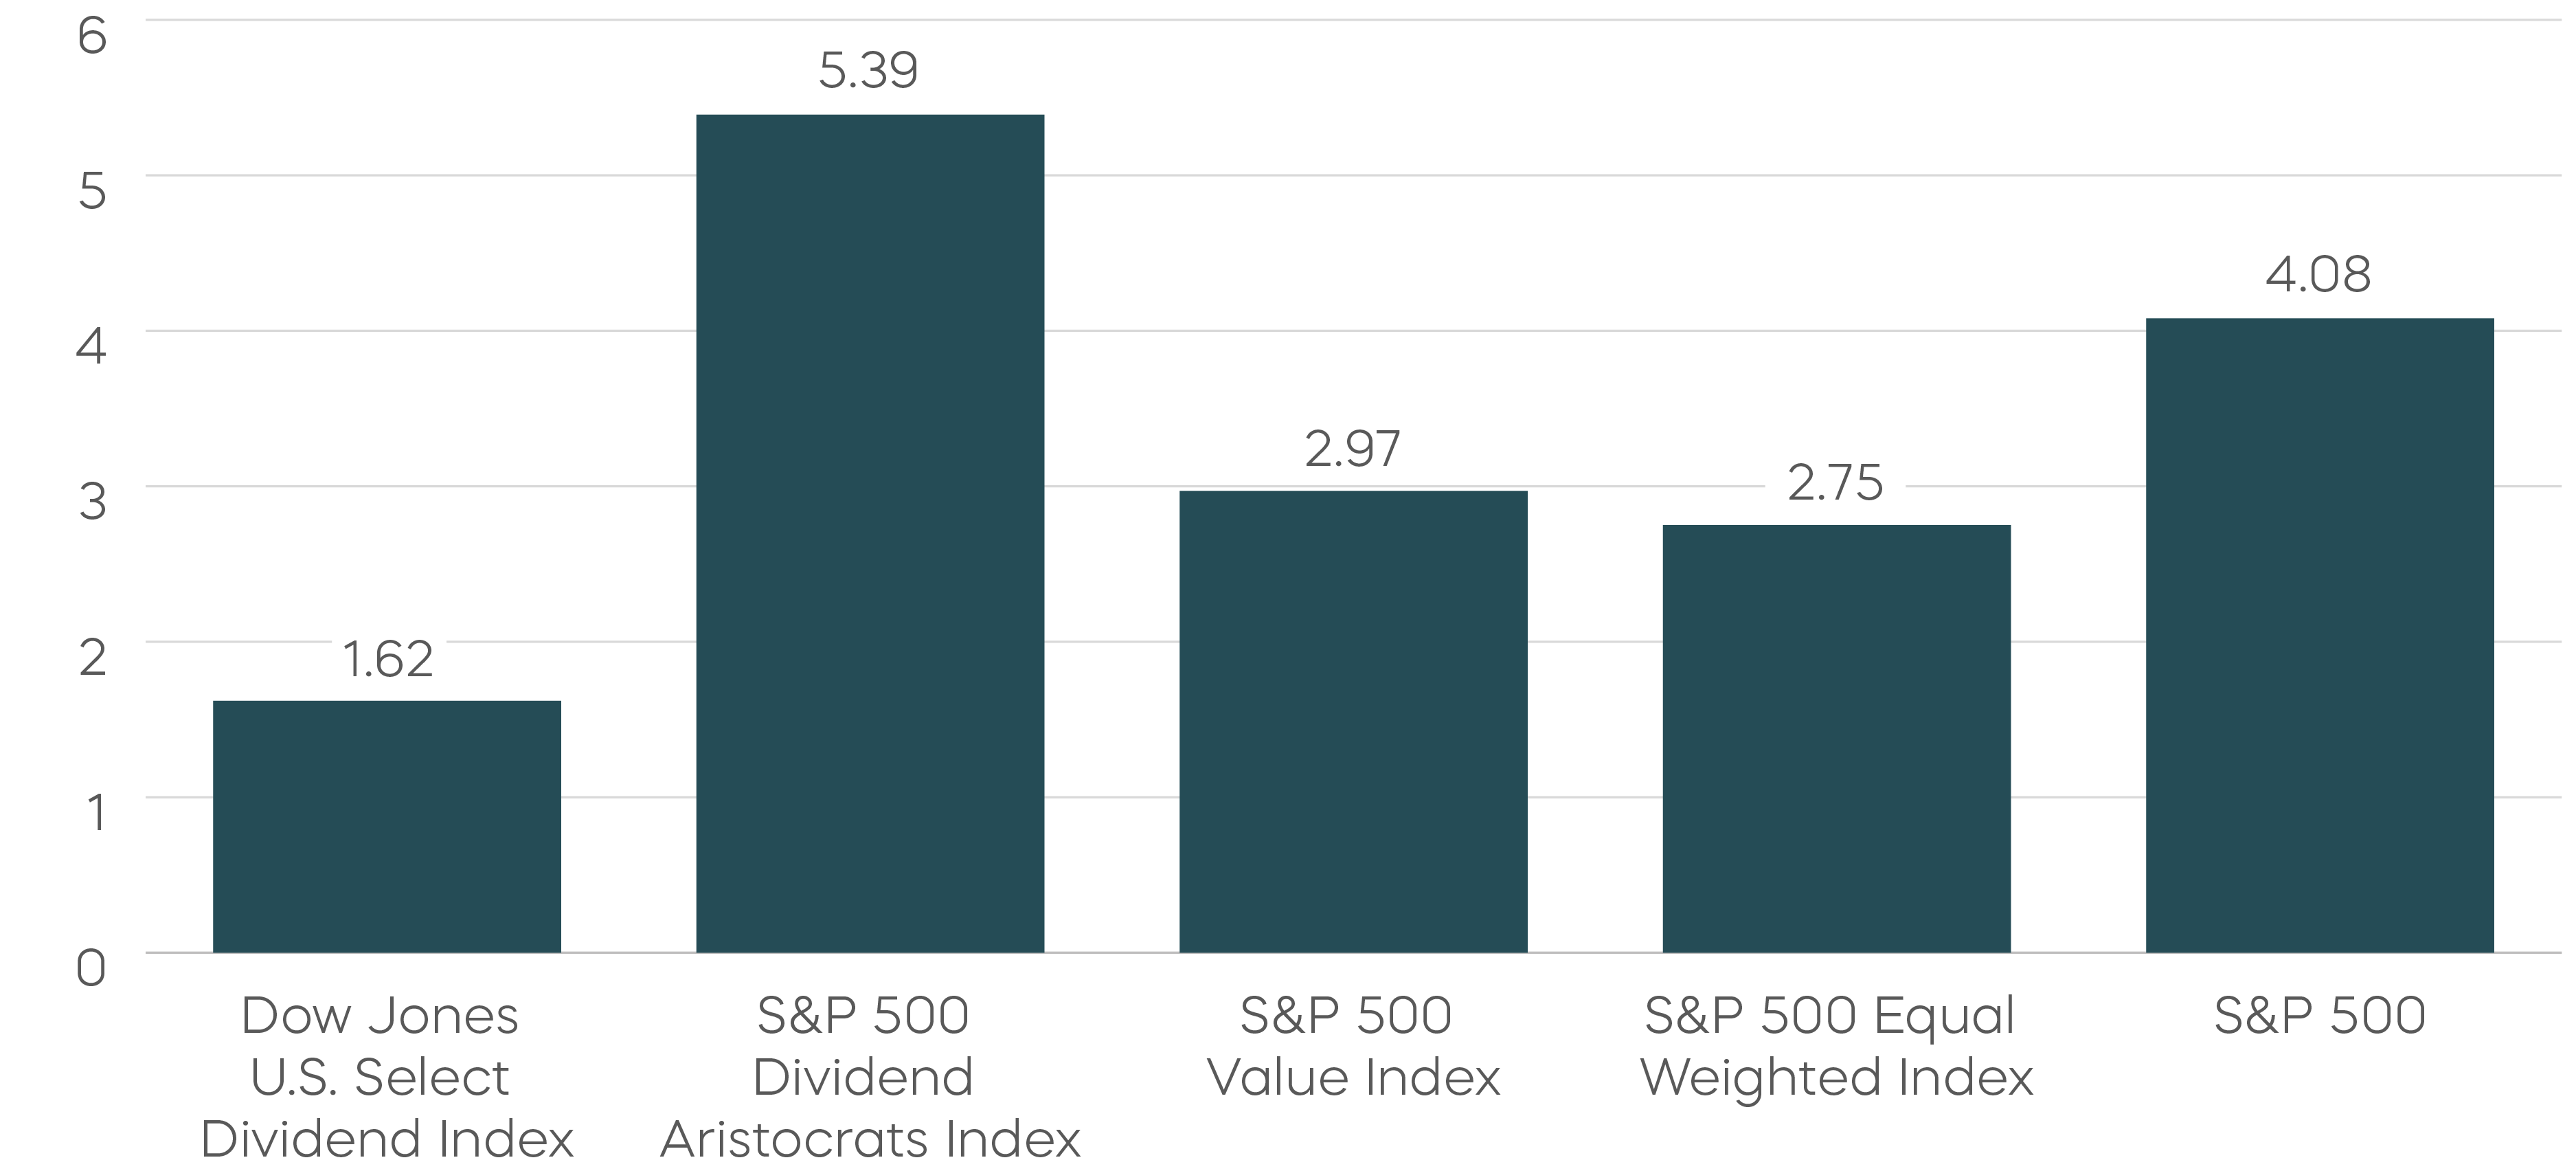
Source: Bloomberg. Year-to-date total returns from 12/31/24 to 2/28/25. Return on asset as of 3/3/25. “Return on assets” measures how efficiently a company is using its assets to generate profits, calculated by dividing net income by total assets. Index returns are for illustrative purposes only and do not reflect any management fees, transaction costs or expenses. Indexes are unmanaged, and one cannot invest directly in an index. Past performance does not guarantee future results.
Performance Recap
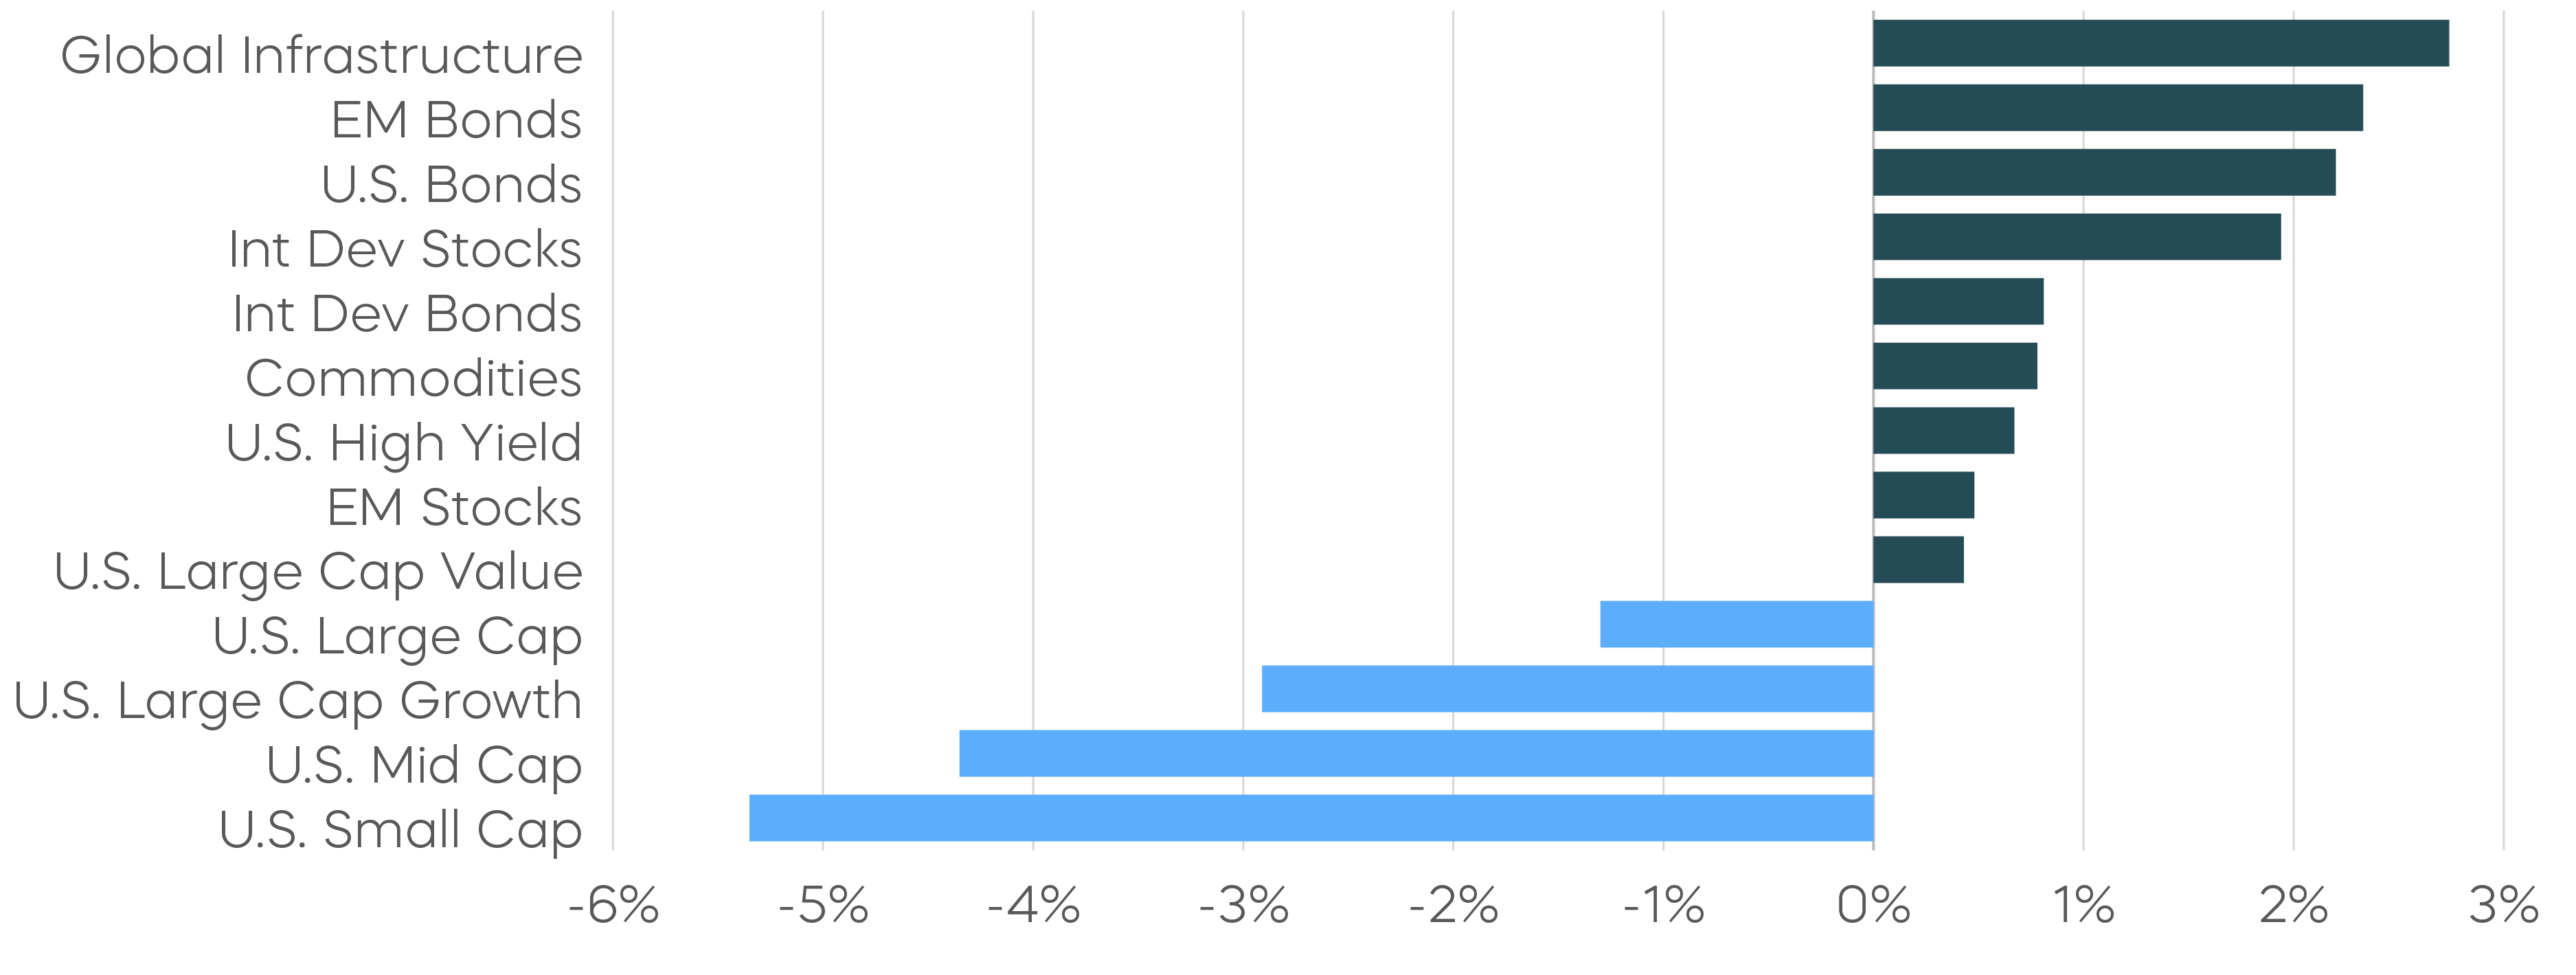
International developed stocks continued to lead the gains while U.S. equity markets broadly retreated. U.S. small-cap stocks underperformed their mid- and large-cap counterparts. The S&P 500 Equal Weighted Index outperformed the market-cap weighted S&P 500 for a second consecutive month.
Asset Class Returns—February 2025
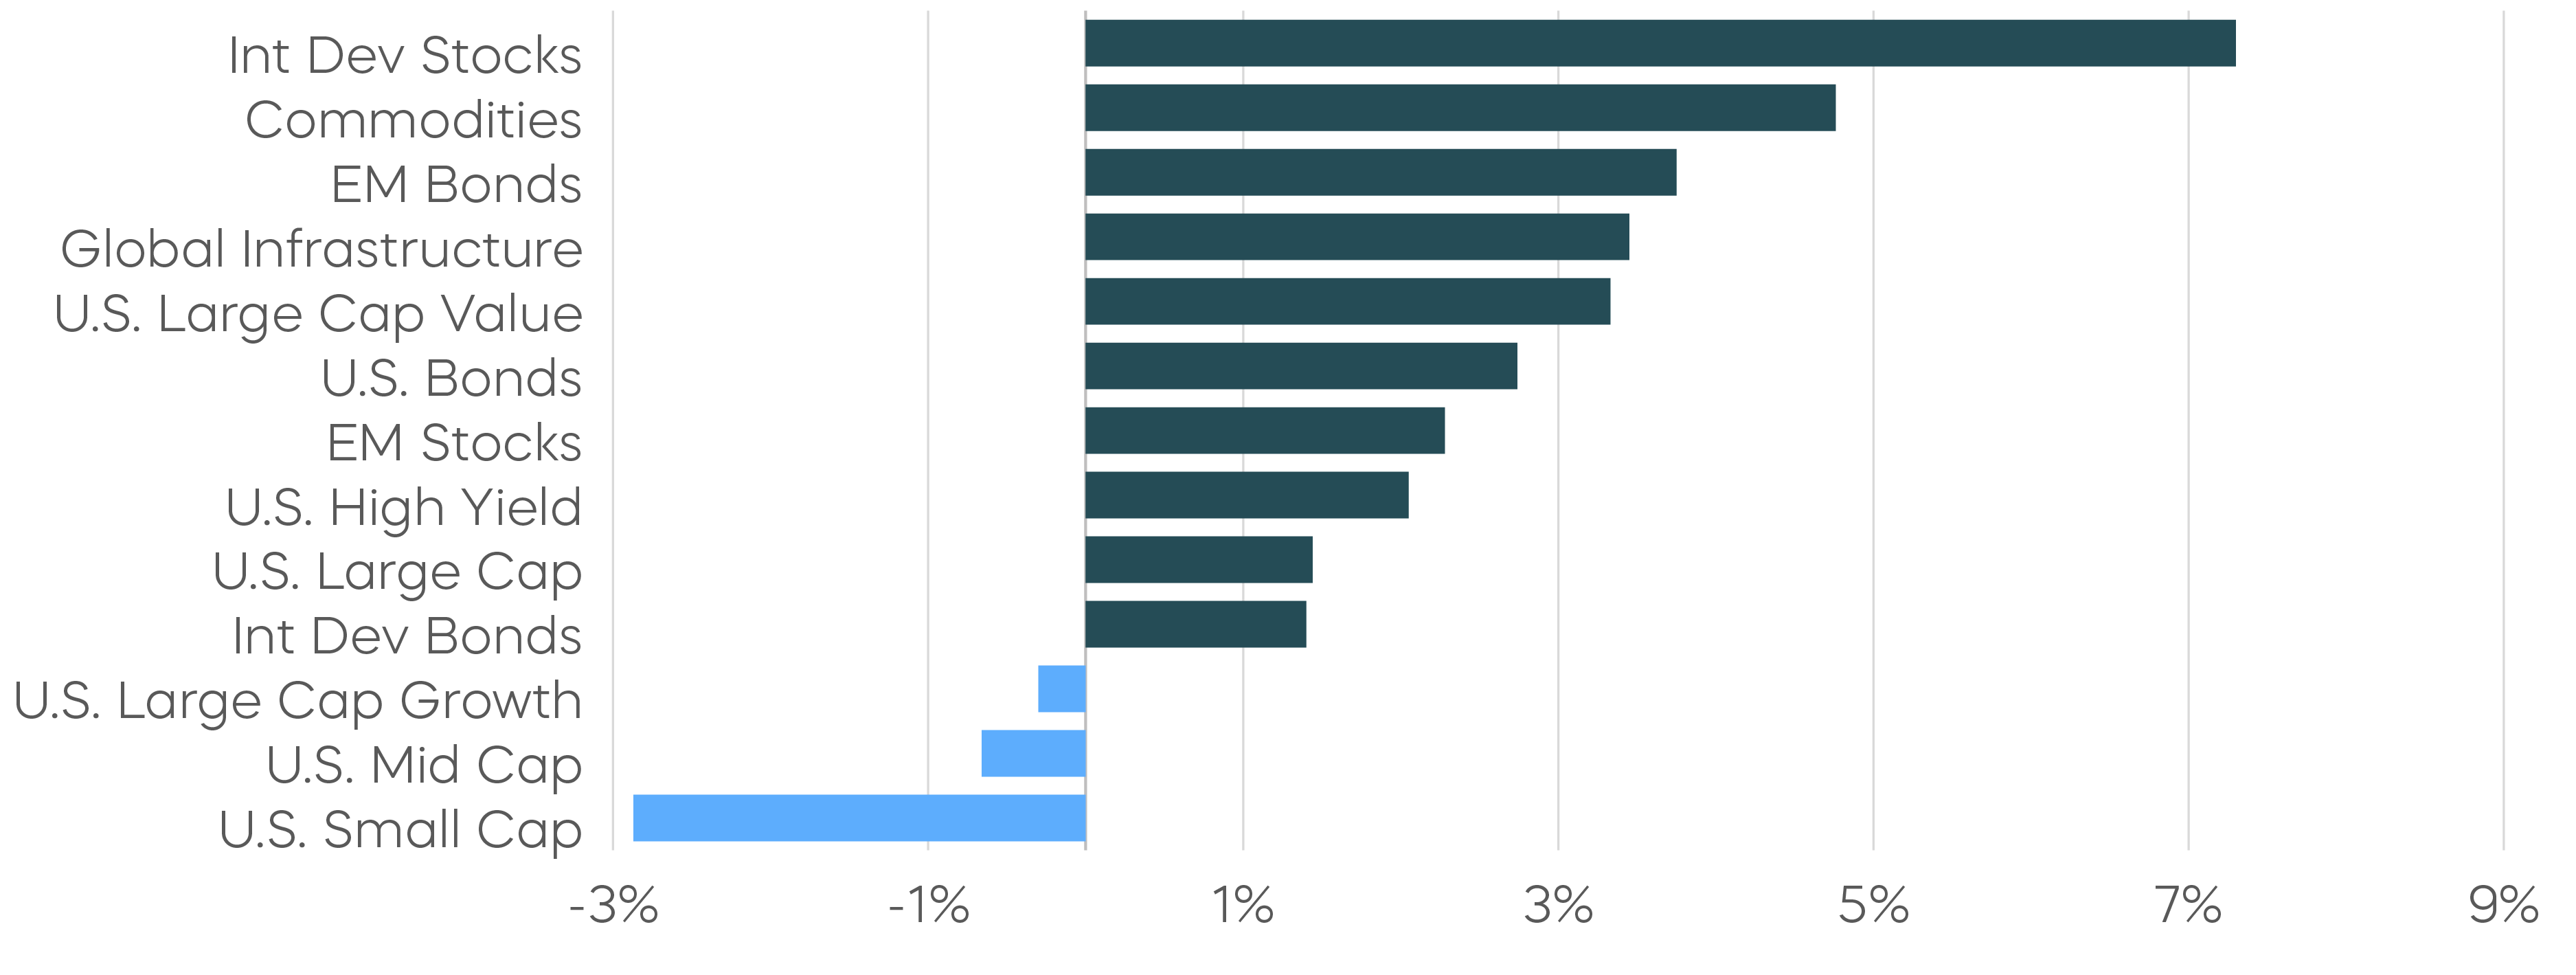
Asset Class Returns—Year to Date
 Source: Bloomberg. February returns 2/1/25–2/28/25; year-to-date returns 1/1/25‒2/28/25. Index returns are for illustrative purposes only and do not reflect any management fees, transaction costs or expenses. Indexes are unmanaged, and one cannot invest directly in an index. Past performance does not guarantee future results.
Economic Calendar
Here is a list of key and upcoming economic releases, which may serve as a guide to potential market indicators.
 Source: Bloomberg. Data as of 3/3/25.
Equity Perspectives

Uncertainty Casts Its Shadow
The S&P 500 and Nasdaq-100 ended February with modest losses and markets have clearly lost momentum of late. Executive orders around tariffs, the prospect of federal job reductions, and questions over Ukraine have all led to significant uncertainty for equity investors. Ironically, the weakness is happening amidst a measure of clarity appearing in the earnings picture. S&P 500 companies overall delivered the highest level of growth since 2001 (18%, per FactSet, as of 2/28/25) during the recently completed Q4 earnings season.
However, for the second month in a row, the Magnificent 7 stocks actually detracted from the performance of the S&P 500. If the rotation out of high-momentum growth stocks has indeed begun, it may be time to find an investment strategy with the potential to deliver all-weather performance.
The Dividend Aristocrats Are On Sale (And That’s Been a Buy Signal)
An obvious antidote for uncertainty is, of course, greater certainty. A timely strategy to consider may be the consistent dividend growth of the Dividend Aristocrats. When companies announce a dividend increase, it sends a powerful message of management’s confidence in the underlying fundamentals of a business—an especially valuable signal during periods of uncertainty.
Since their inception, both the S&P 500 Dividend Aristocrats and S&P MidCap 400 Dividend Aristocrats have produced better risk-adjusted returns compared to their large- and mid-cap benchmarks. They tend to shine brightest during periods of volatility and have generally held up better than broad market averages during drawdowns. They have also outperformed the market on a year-to-date basis, as noted earlier. What’s more, they now trade at large discounts compared to their historical averages, as you can see in the following chart.
Dividend Aristocrats Relative Are Trading at a Discount vs. Historical Averages
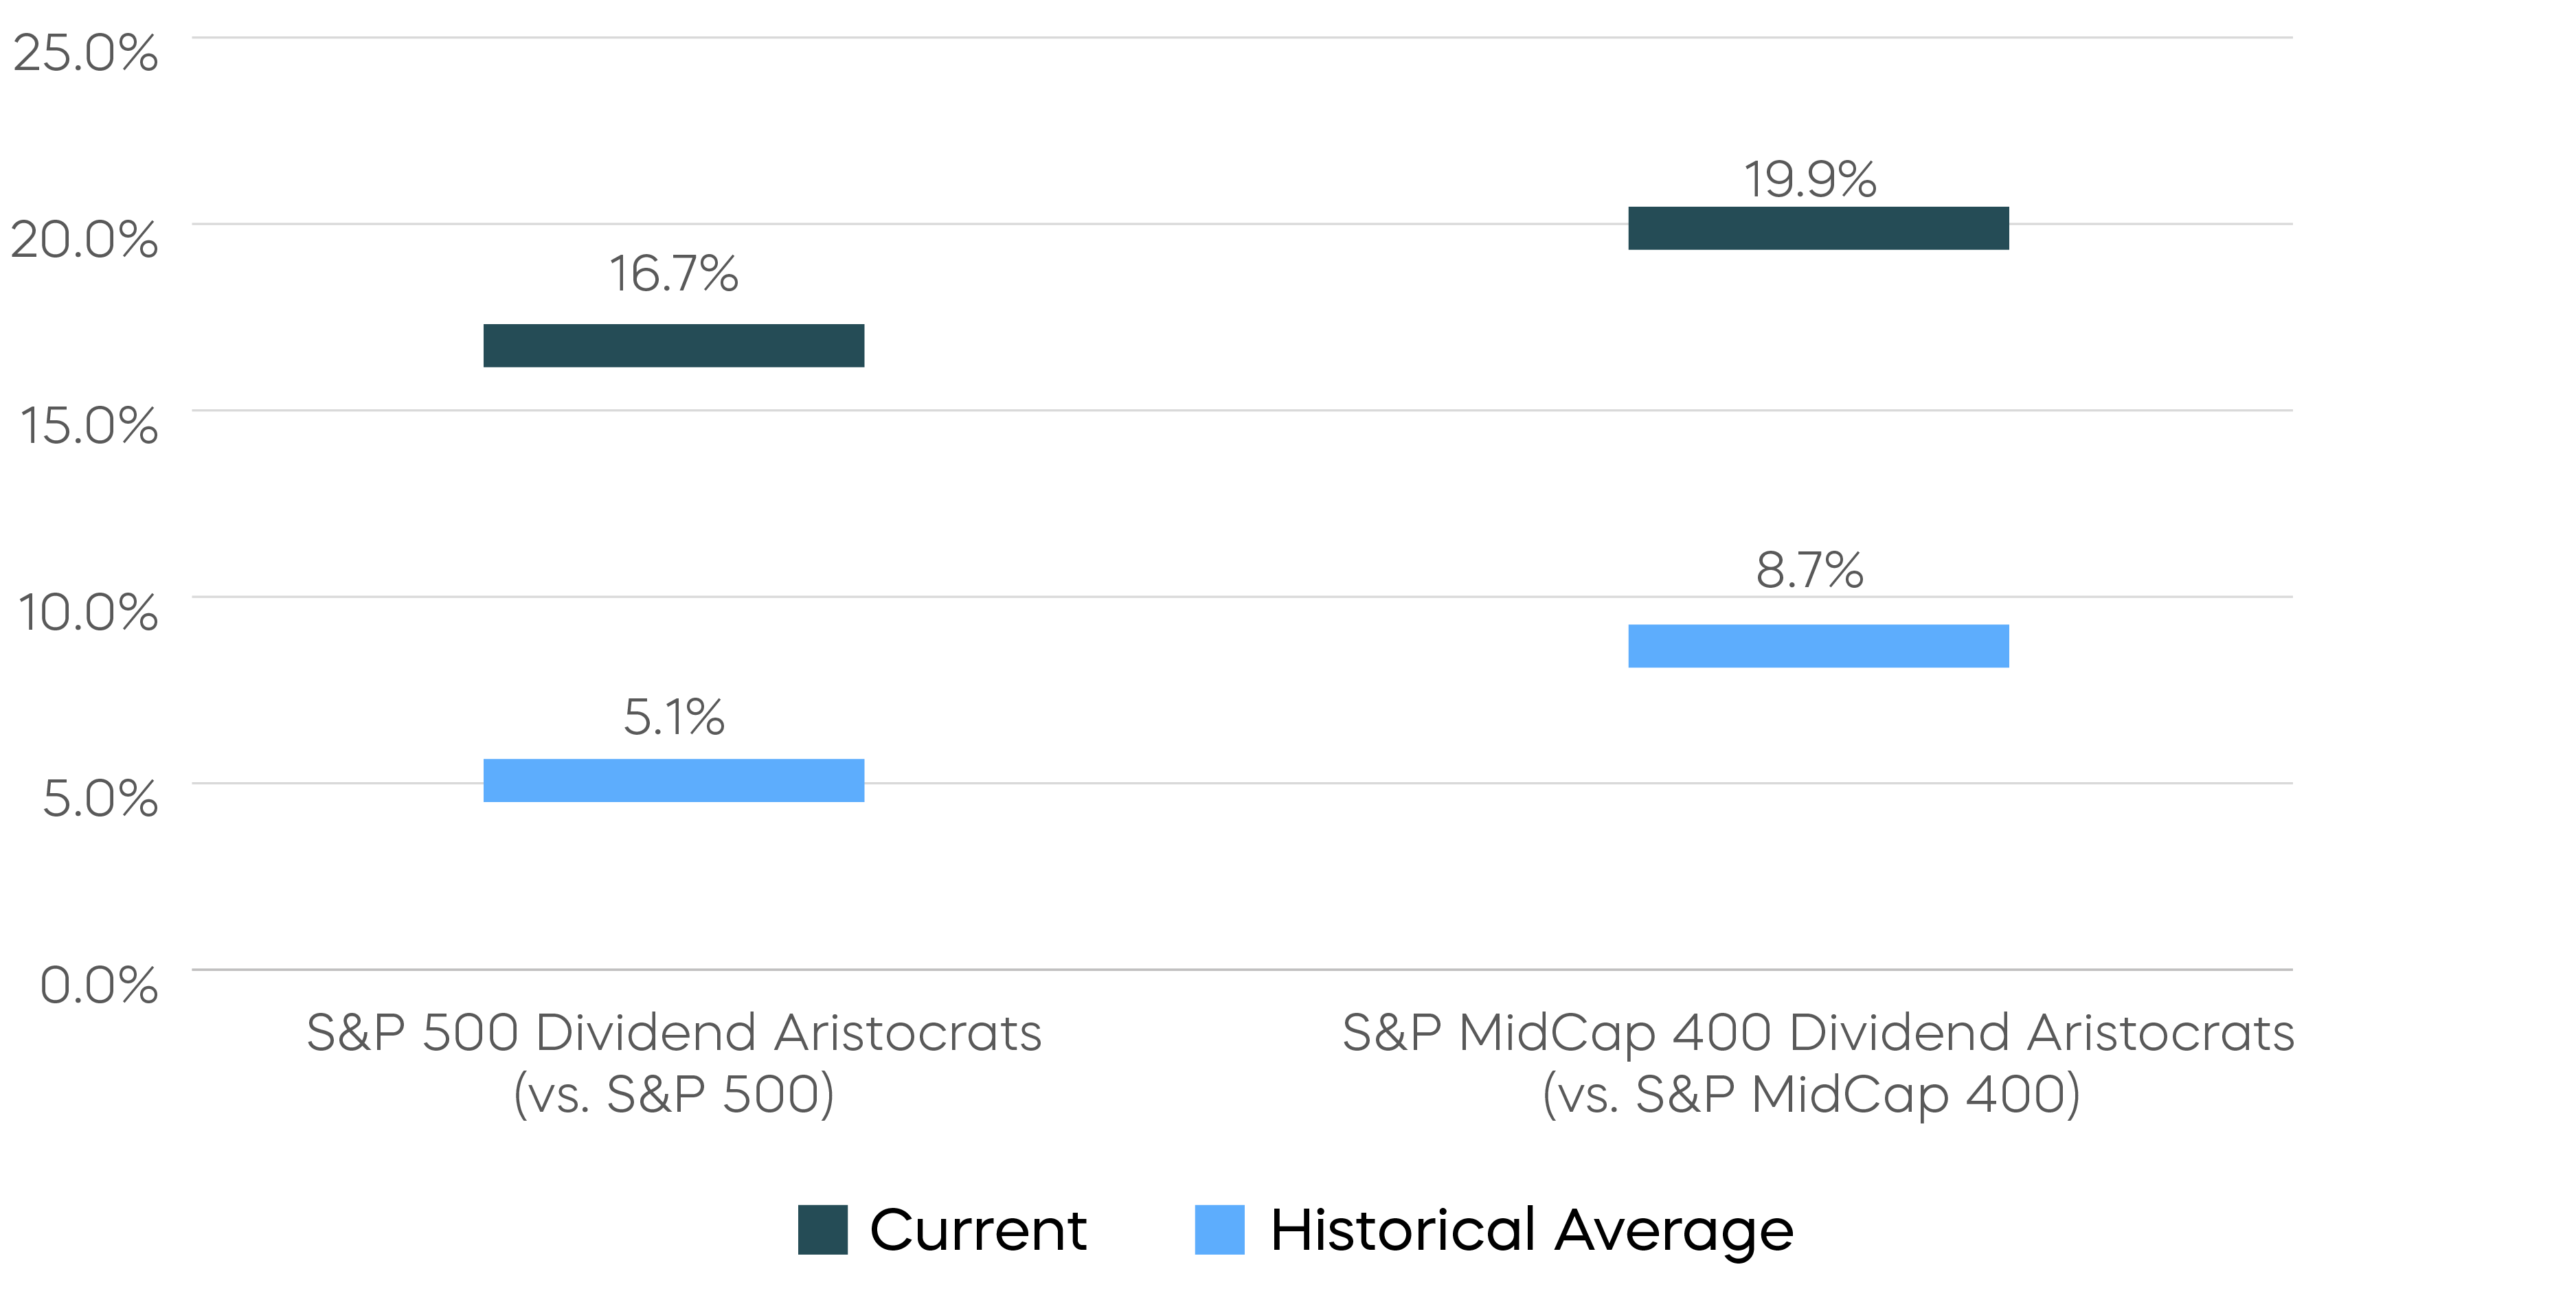
Source: Bloomberg, data as of 2/28/25. “Price-to-earnings” (P/E) shows how much investors are paying for a dollar of a company's earnings. P/E helps to assess the relative value of a company’s stock by measuring its share price relative to its earnings.
There’s good reason to believe recent Dividend Aristocrat outperformance has the potential to continue. Prior periods when the Aristocrats traded at similar relative valuations have often preceded strong periods of outperformance, which could make today’s valuation levels a potential buy signal.
When the Dividend Aristocrats have traded at similar discounts to today’s levels, the Aristocrats have gone on to outperform the S&P 500 over the subsequent five-year period by an average of 3.7% annualized.
Fixed Income Perspectives

Credit spreads widened, and Treasury yields declined as investors moved away from risk assets amid heightened market volatility in February. The 10-year Treasury yield dropped by 33 basis points, reflecting a potential shift toward safety.
Fixed Income Returns—February 2025
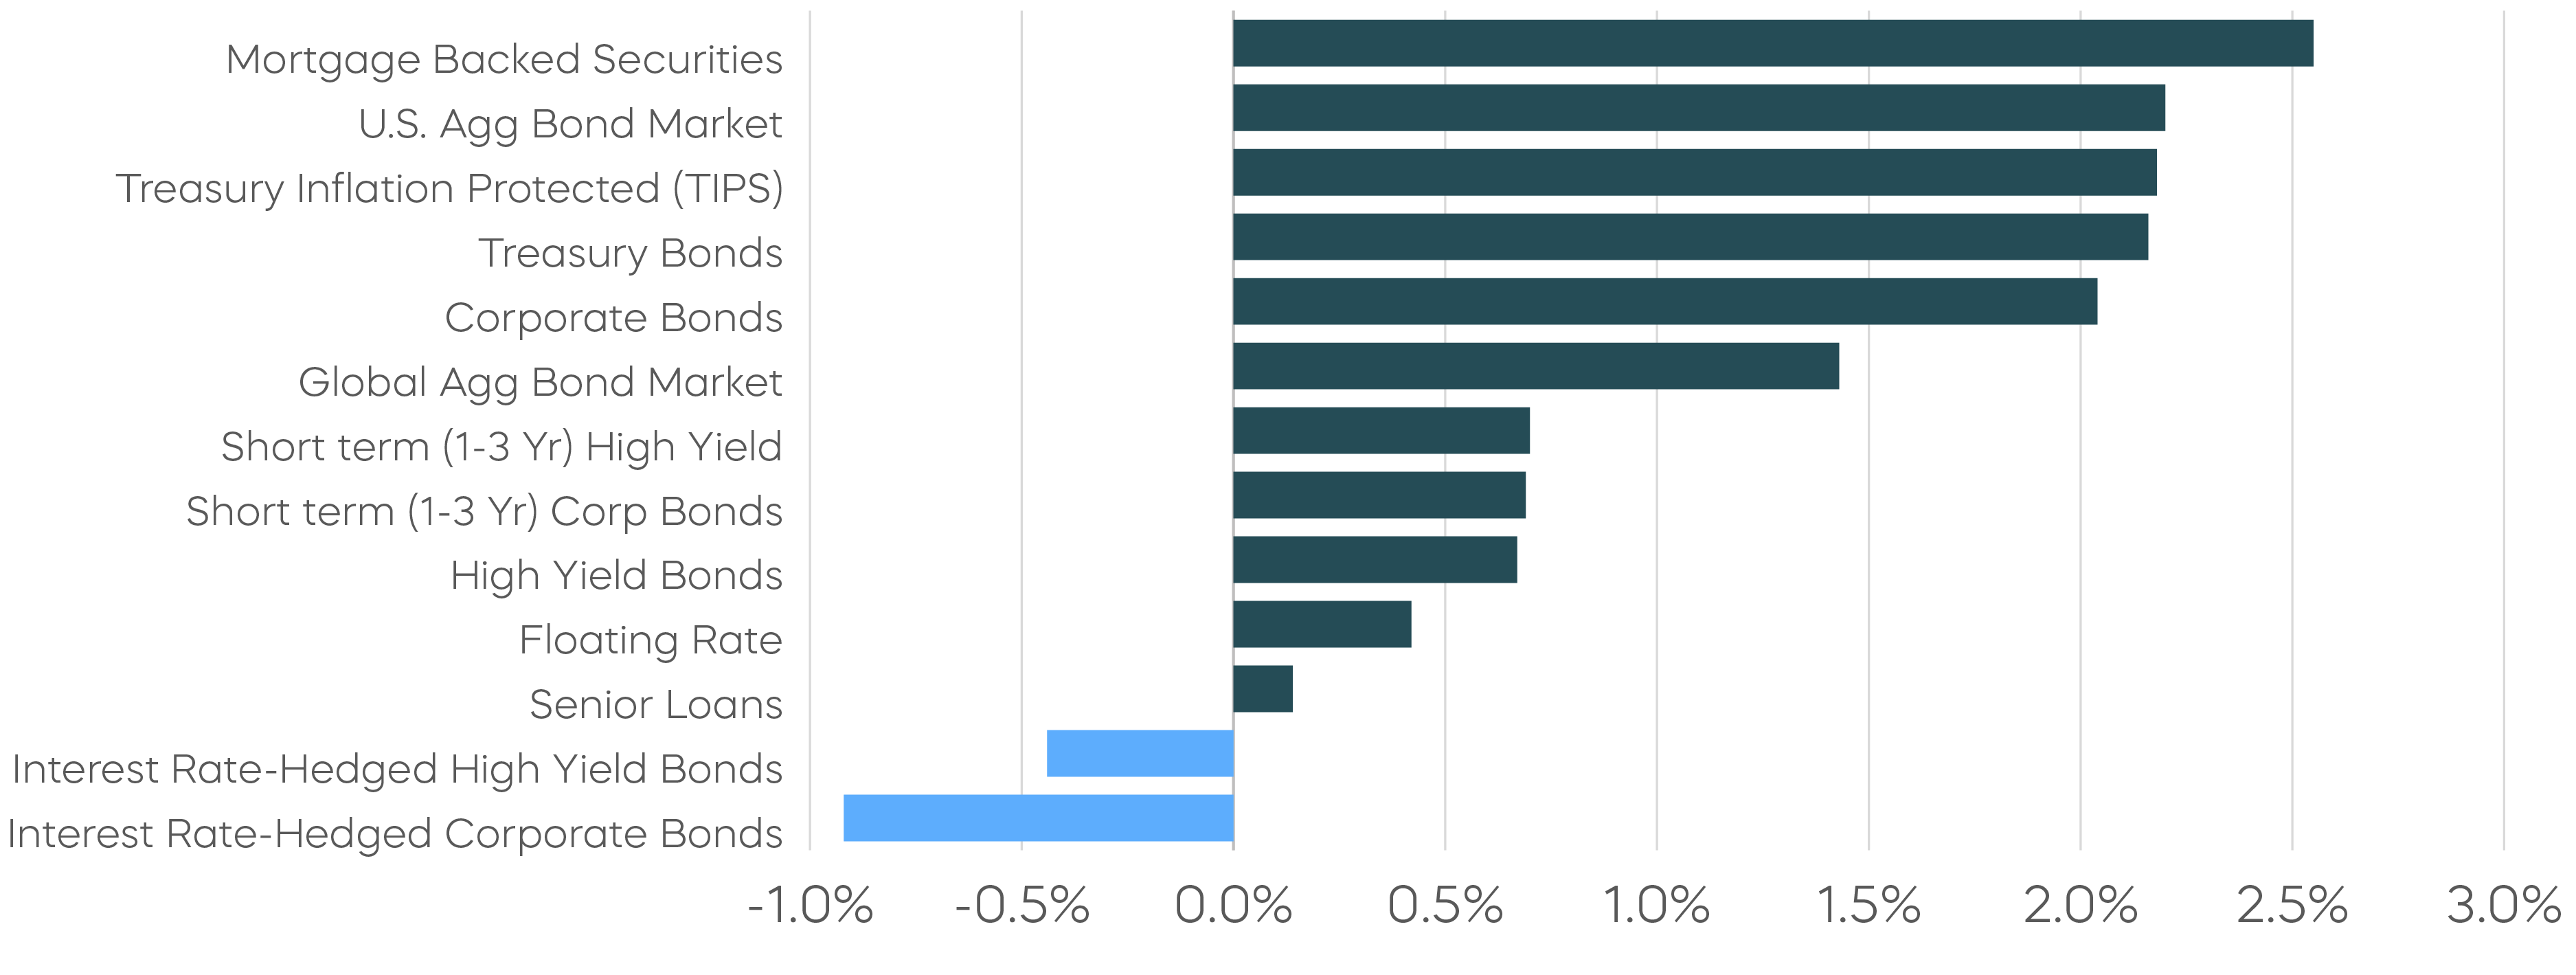
Source: Bloomberg. February returns 2/1/25–2/28/25. Index returns are for illustrative purposes only and do not reflect any management fees, transaction costs or expenses. Indexes are unmanaged, and one cannot invest directly in an index. Past performance does not guarantee future results.
Squinting Your Eyes
More than a month into Trump’s presidency, investors are still adjusting to the relentless barrage of headlines. Amidst the chaos, the bond market has staged an impressive price rally. While the Treasury Department’s conservative approach to managing debt maturities has helped ease near-term supply concerns, the primary driver of lower bond yields remains a broad risk-off sentiment fueled by policy uncertainties and volatility in the risk markets.
We, however, prefer to focus on fundamental economic and inflationary trends. That brings us to the theme of this month’s fixed income perspective: Squinting your eyes can often help you see what’s in front of you with greater clarity.
A Clearer Look at the Labor Market
Non-farm payrolls, the most widely followed measure of job growth, showed a healthy average monthly gain of 166,000 jobs last year. However, concerns have lingered over the household survey, a separate labor market measure that has been reporting slower employment growth.
January’s employment report delivered an upward revision to the household survey stemming from higher population estimates that better reflected immigration trends, bringing the labor indicators into closer alignment. A Brookings Institution study last year suggested that previous undercounting of population led to an underestimation of employment growth for both foreign-born and U.S.-born workers. The latest revision clarifies the discrepancy and provides the Federal Reserve with encouraging evidence of labor market resilience.
Alignment of Non-Farm Payroll vs. Household Survey Job Growth
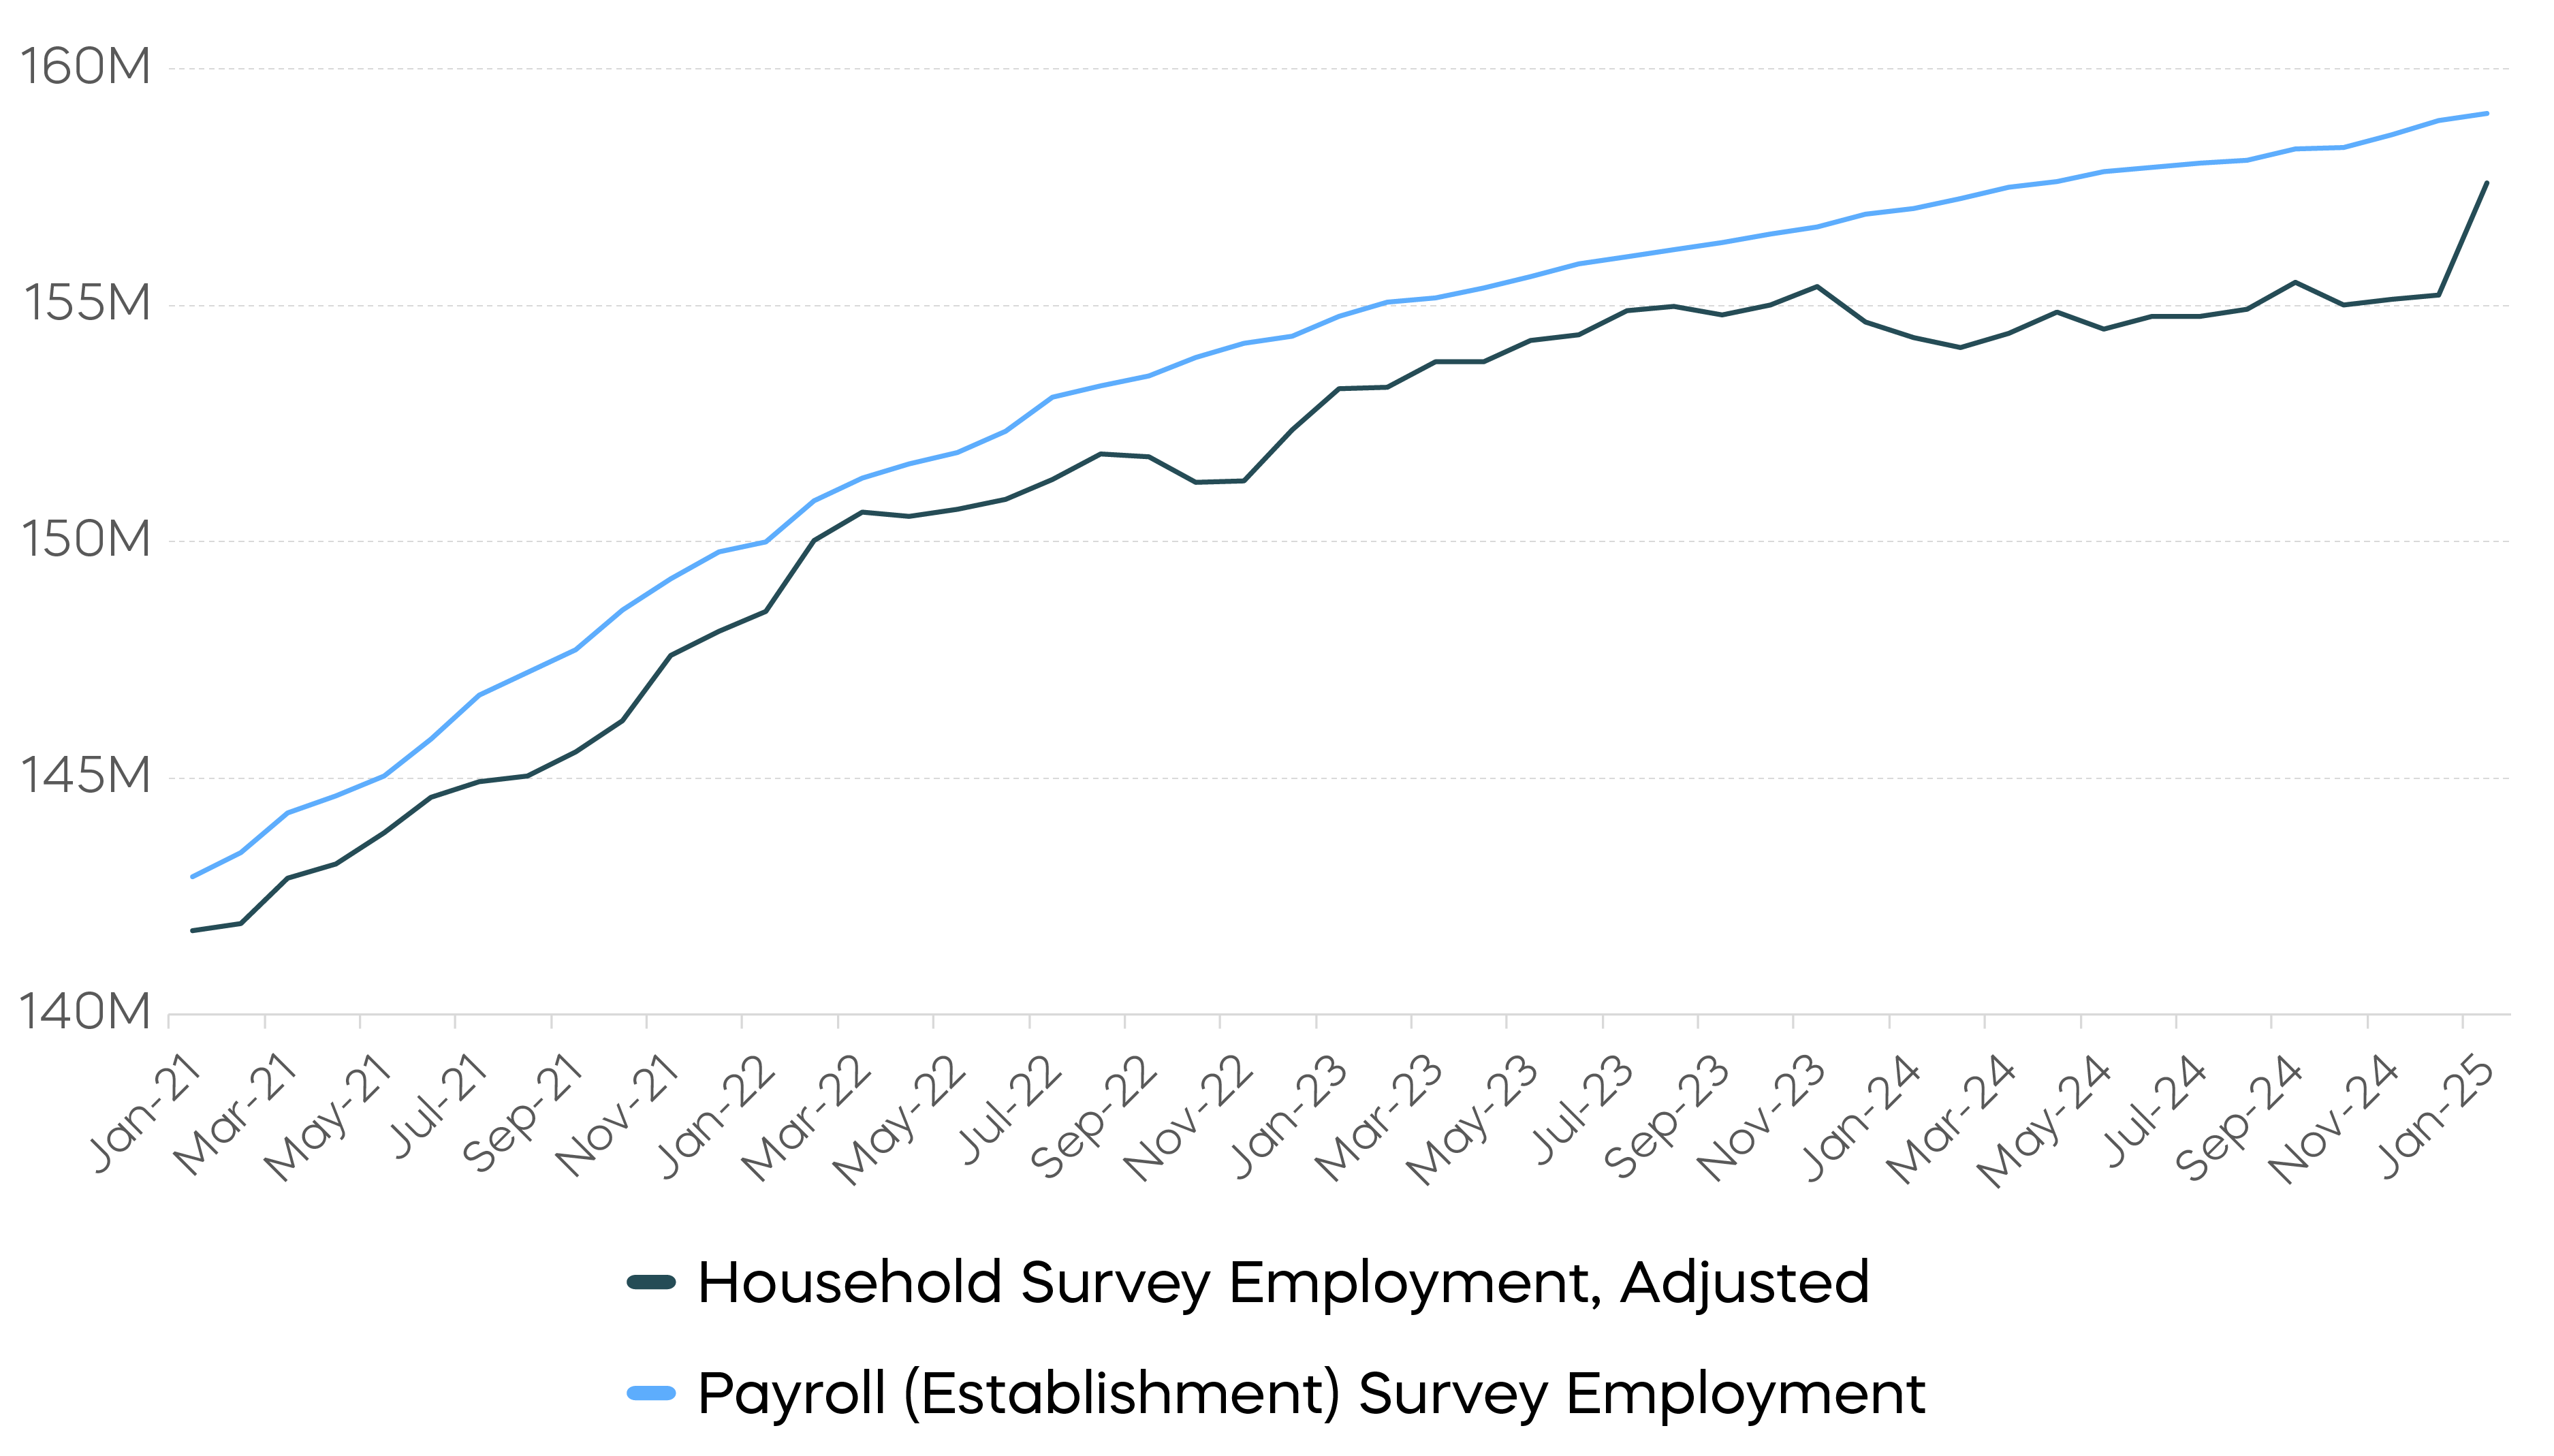
Source: Bureau of Labor Statistics, data as of January 2025.
A Closer Look at Housing
Also worth a closer look is the housing market. Rental inflation—a key component of overall inflation—remains above pre-pandemic levels but has gradually trended lower. Despite the Fed Funds Rate peaking more than 17 months ago, new housing construction remains sluggish. Both housing starts and building permits have been stagnant, even as home prices have risen.
The Number of Housing Starts and Building Permits Have Flatlined
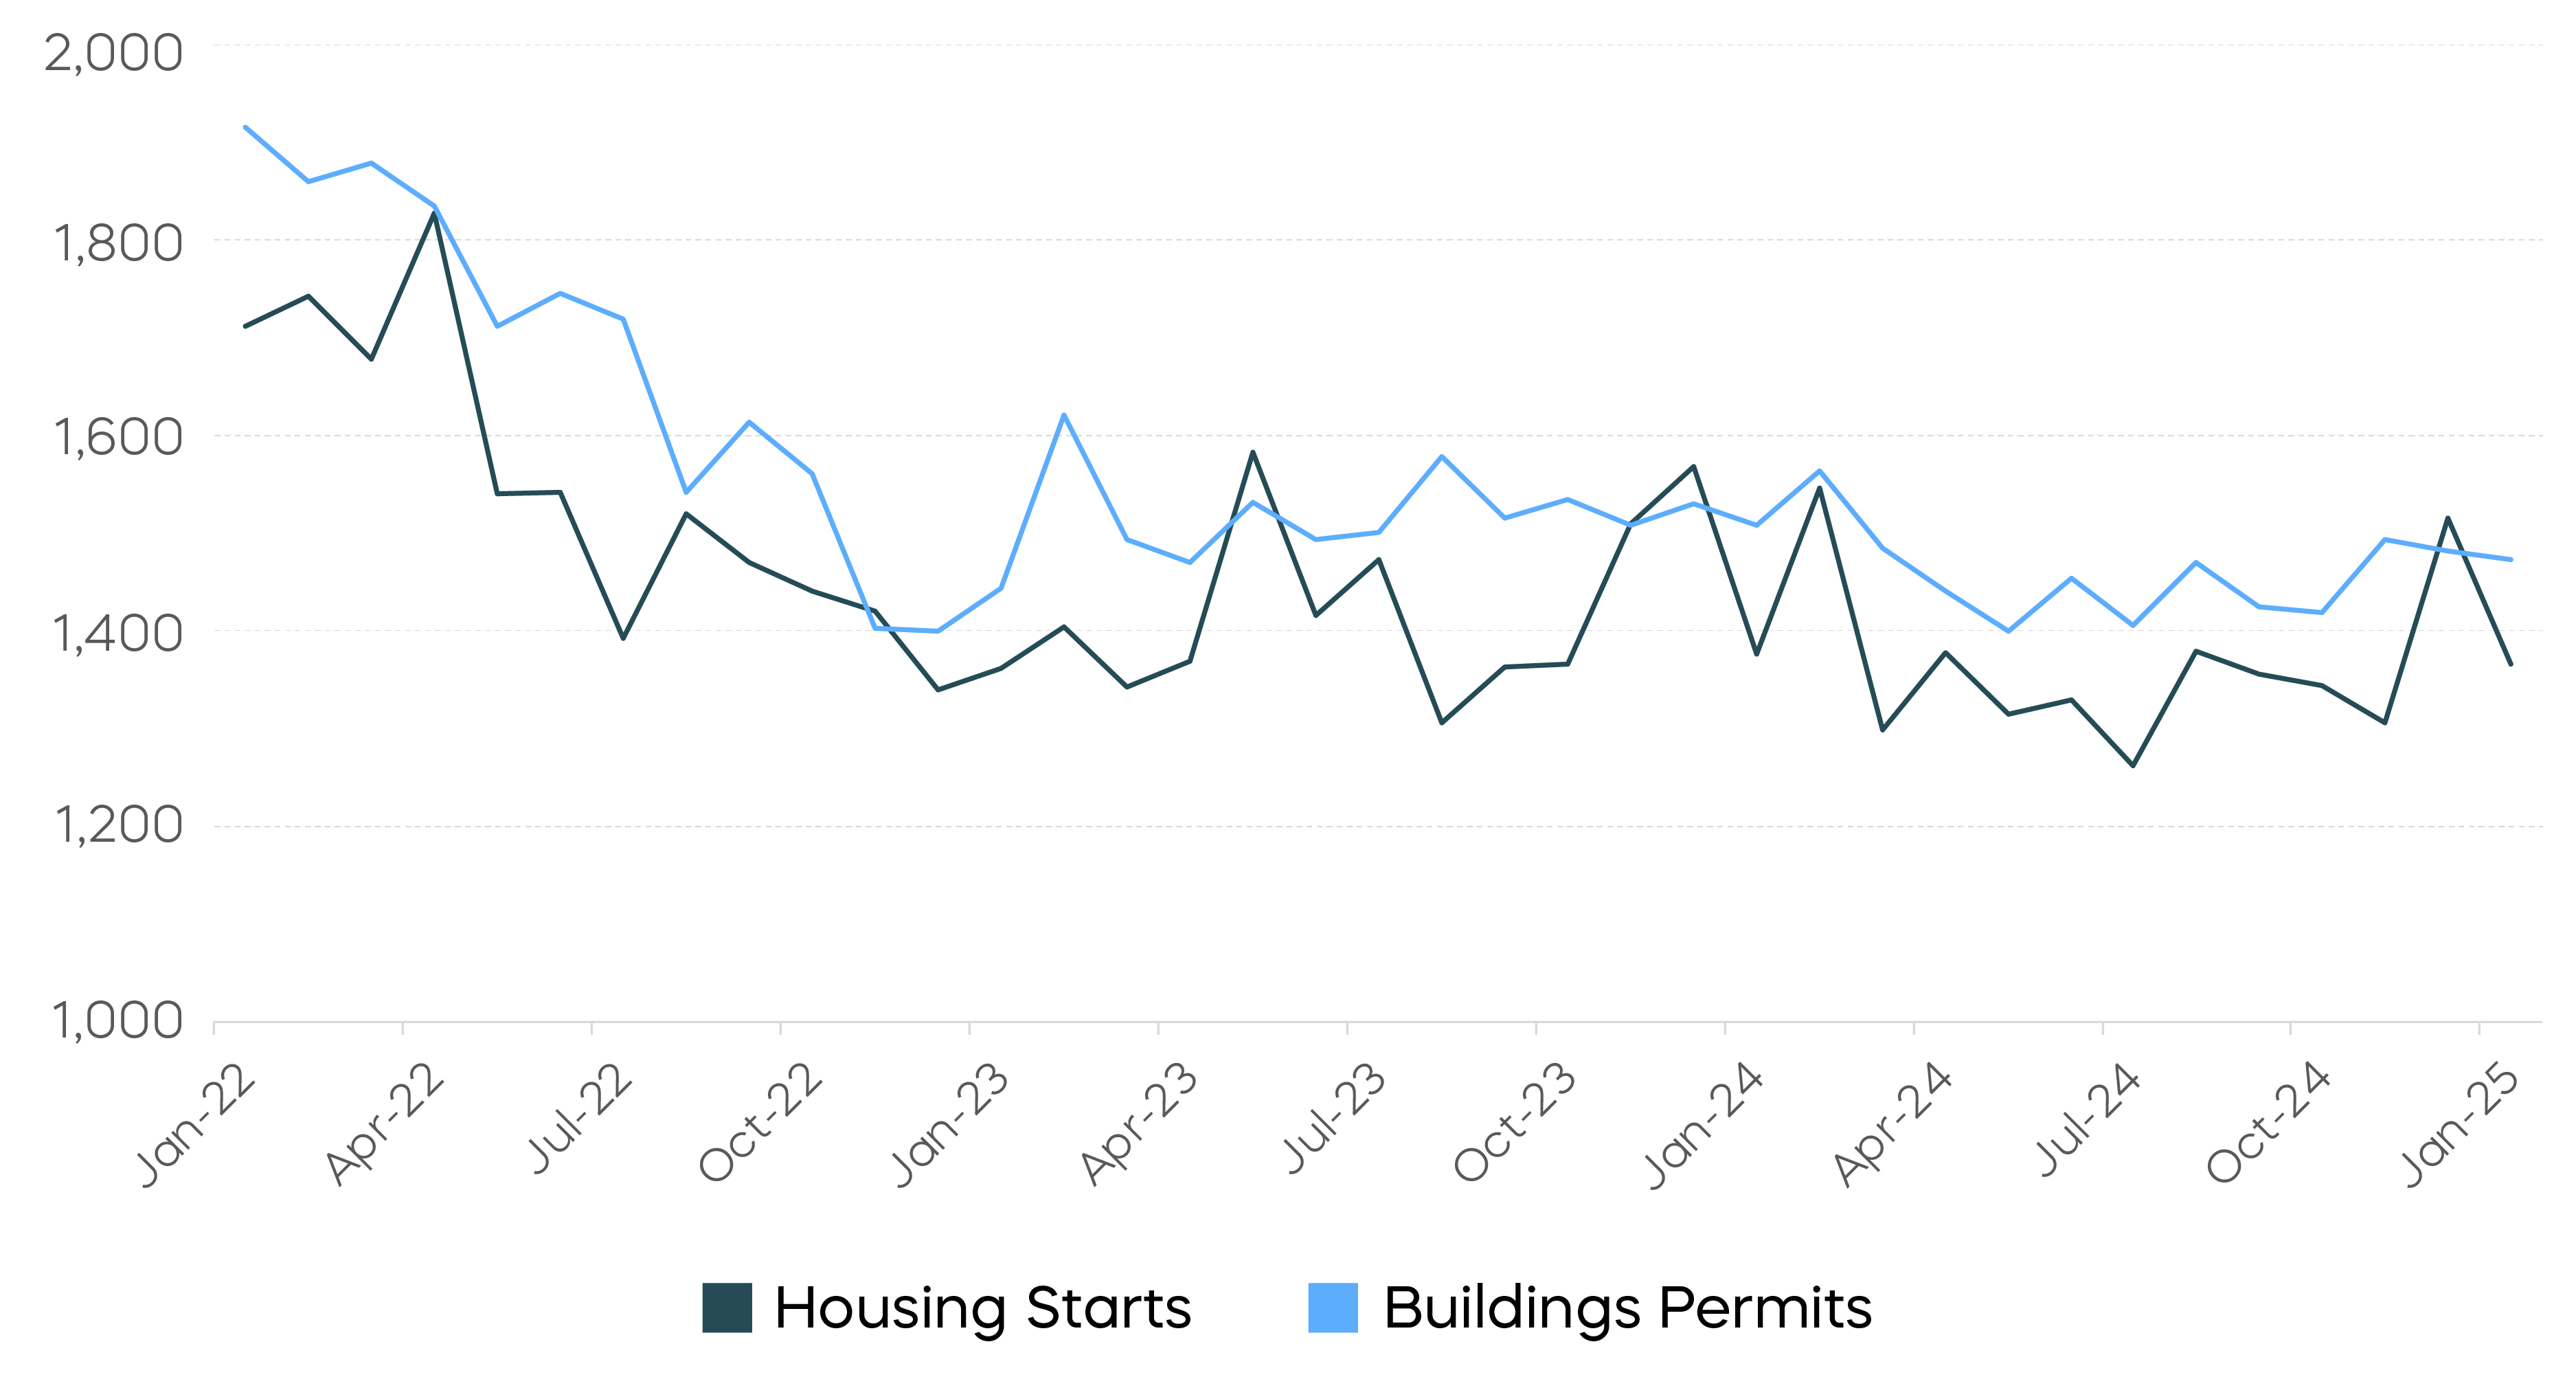
Source: U.S. Census Bureau, data as of January 2025.
This suggests that the supply elasticity of housing is low, meaning builders are not responding as strongly to changes in monetary policy. If housing supply remains constrained, home prices could become more sensitive to interest rate shifts.
Looking at three recent stages of Fed tightening and easing, home price fluctuations have been more responsive to monetary policy than rental prices. This observation contradicts the conventional view that renting and homeownership are economic substitutes. On one hand, higher home prices can boost household wealth and support consumer spending. On the other hand, slower rental inflation may help stabilize overall inflation and reinforce the Fed’s confidence that inflation will continue trending lower.
Home Price Has Been More Responsive to Monetary Policy than Rental Price
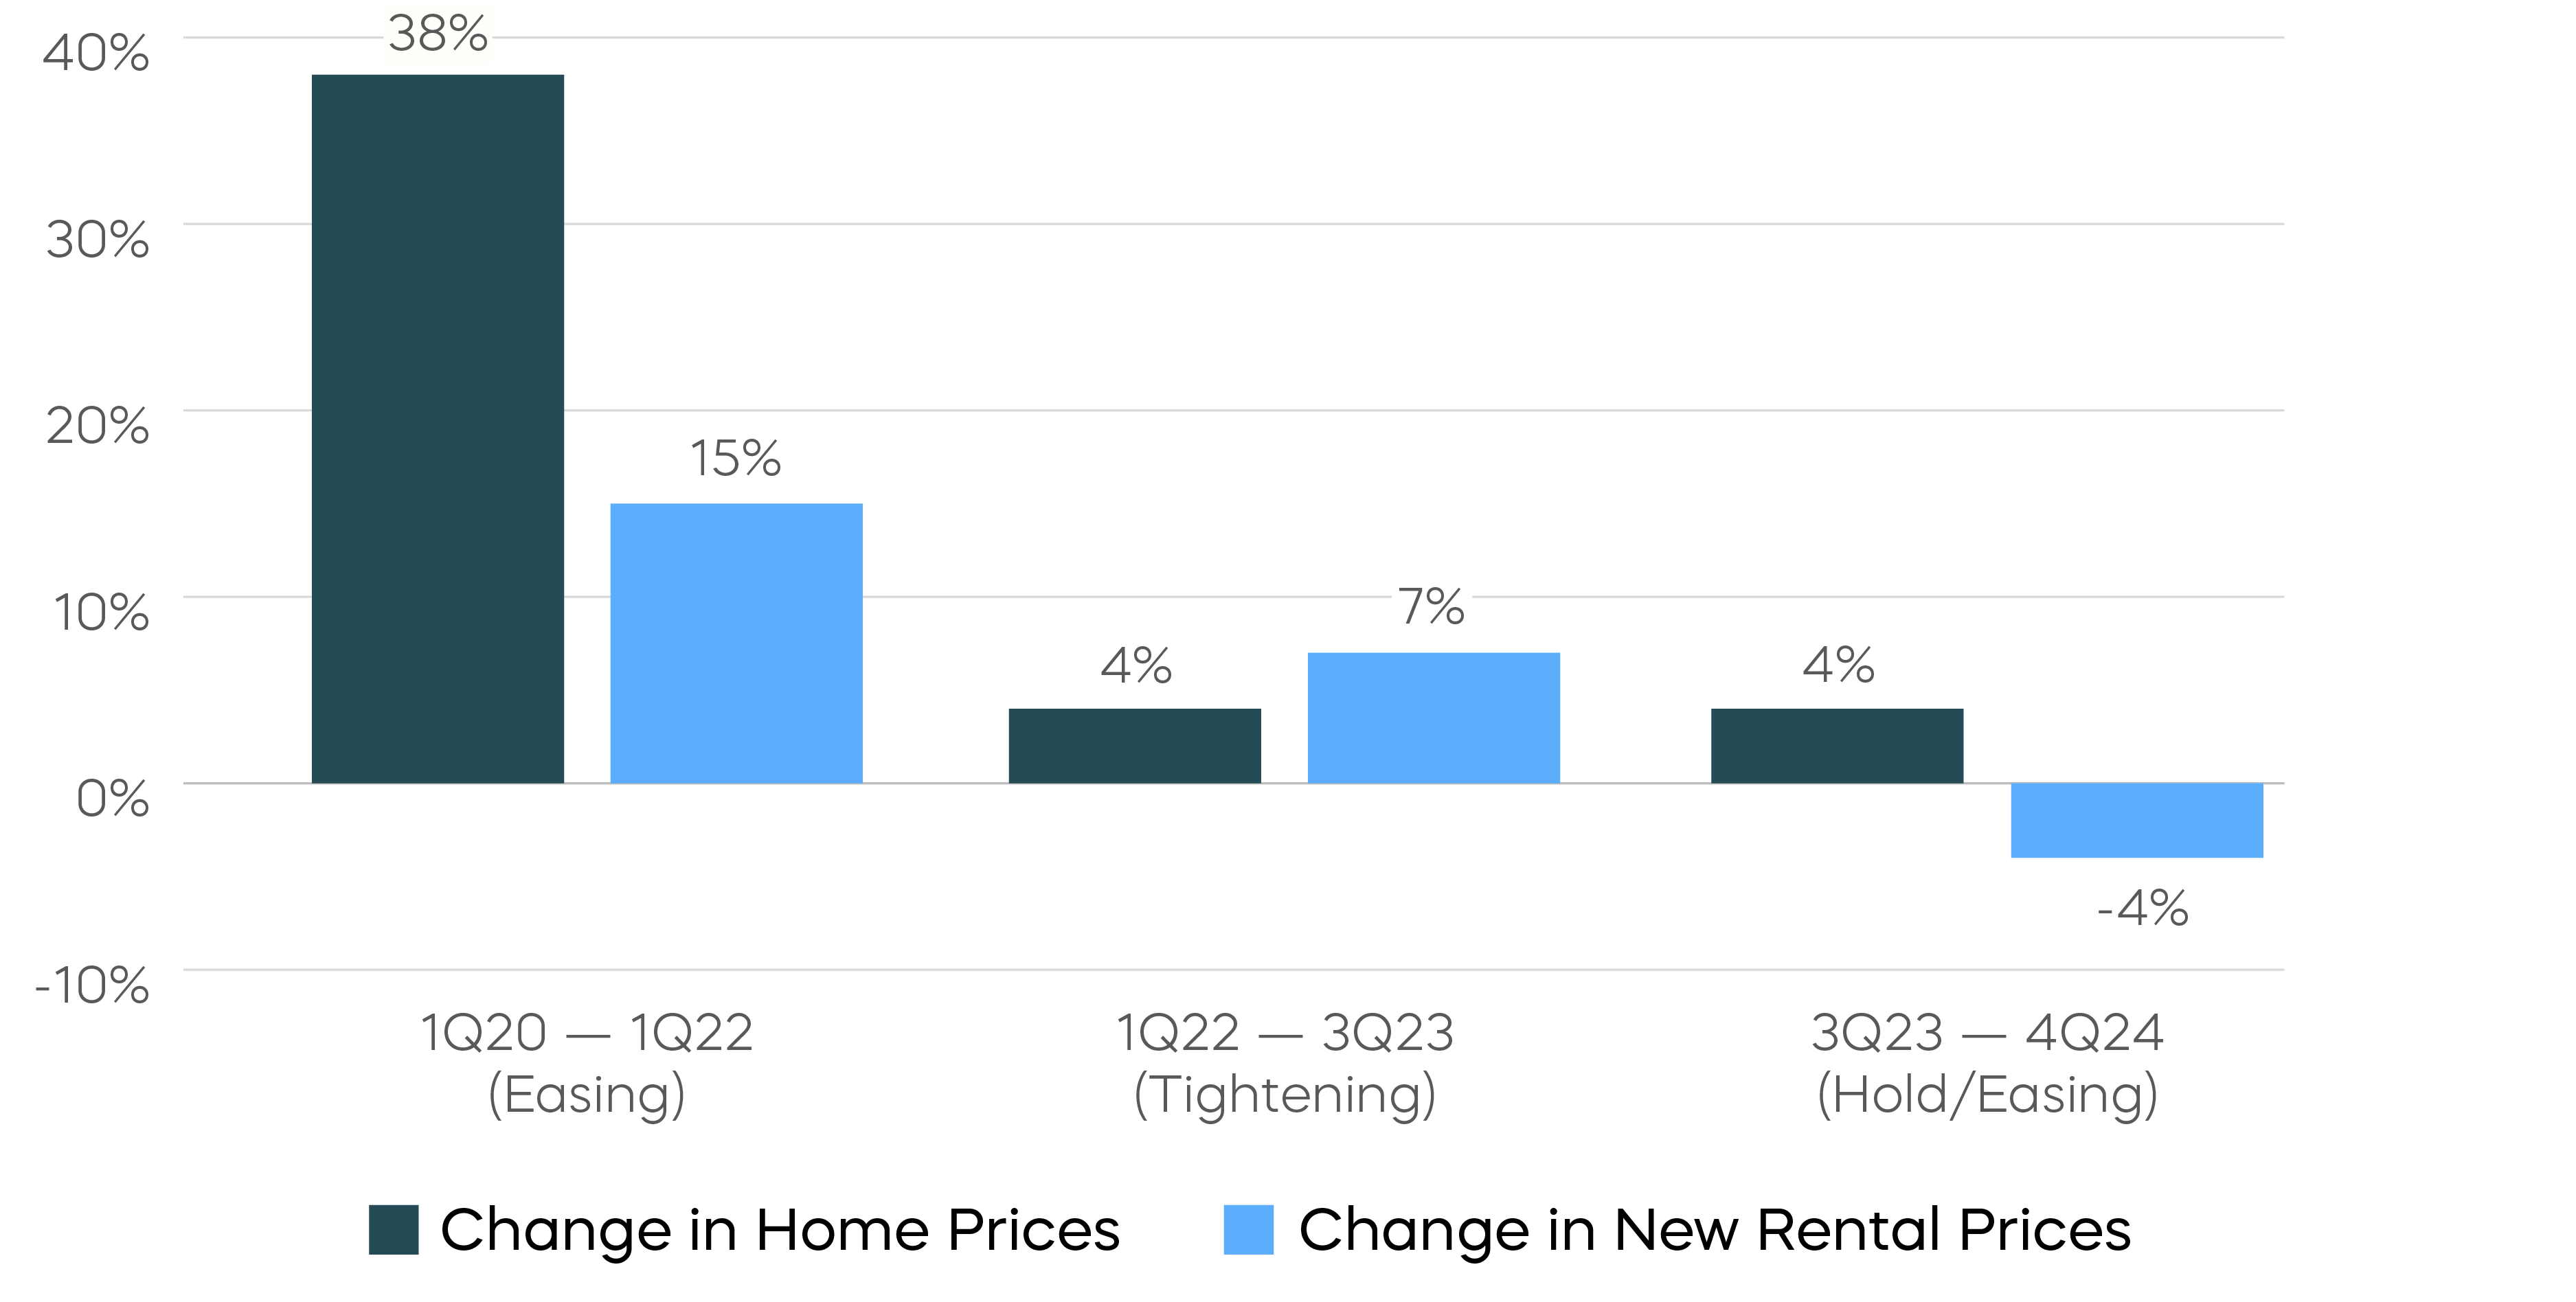
Source: Bloomberg, data from 1Q2020 to 4Q2024. S&P CoreLogic Case-Shiller 20-City Composite Home Price NSA Index. Bureau of Labor Statistics New Tenant Rent Index. Easing and tightening stages identified by federal funds rate.
Filtering Out the Noise
When we squint and strip away some of the distortions, the economy still seems to reflect a resilient labor market and inflation gradually moving toward target. This suggests the Fed is likely to adopt a wait-and-see approach in the near term. With rate cuts not widely anticipated in the first half of the year, ongoing policy uncertainty adds to the risk of higher interest rates. For now, hedging some interest rate risk in bond portfolios may be a prudent move.
Sources for data and statistics: Bloomberg, FactSet, Morningstar, and ProShares.
The different market segments represented in the performance recap charts use the following indexes: U.S. Large Cap: S&P 500 TR; U.S. Large Cap Growth: S&P 500 Growth TR; U.S. Large Cap Value: S&P 500 Value TR; U.S. Mid Cap: S&P Mid Cap TR; U.S. Small Cap: Russell 2000 TR; International Developed Stocks: MSCI Daily TR NET EAFE; Emerging Markets Stocks: MSCI Daily TR Net Emerging Markets; Global Infrastructure: Dow Jones Brookfield Global Infrastructure Composite; Commodities: Bloomberg Commodity TR; U.S. Bonds: Bloomberg U.S. Aggregate; U.S. High Yield: Bloomberg Corporate High Yield; International Developed Bonds: Bloomberg Global Agg ex-USD; Emerging Market Bonds: DBIQ Emerging Markets USD Liquid Balanced.
The different market segments represented in the fixed income returns charts use the following indexes: Global Agg Bond Market: Bloomberg Global-Aggregate Total Return Index Value Unhedged USD; Mortgage Backed Securities: Bloomberg U.S. MBS Index Total Return Value Unhedged USD; Treasury Bonds: Bloomberg U.S. Treasury Total Return Unhedged USD; U.S. Agg Bond Market: Bloomberg U.S. Agg Total Return Value Unhedged USD; Corporate Bonds: Bloomberg US Corporate Total Return Value Unhedged USD; High Yield Bonds: Bloomberg U.S. Corporate High Yield Total Return Index Value Unhedged USD; Interest Rate-Hedged High Yield Bonds: FTSE High Yield (Treasury Rate-Hedged) Index; Treasury Inflation Protected (TIPS): Bloomberg U.S. Treasury Inflation Notes TR Index Value Unhedged USD; Short term (1-3 Yr) High Yield: Bloomberg U.S. Corporate 0-3 Year Total Return Index Value Unhedged USD; Senior Loans: Morningstar LSTA U.S. Leveraged Loan 100 Index; Short term (1-3 Yr) Corp Bonds: Bloomberg U.S. Corporate 1-3 Yr Total Return Index Value Unhedged USD; Floating Rate: Bloomberg U.S. FRN < 5 yrs Total Return Index Value Unhedged USD; Interest Rate-Hedged Corporate Bonds: FTSE Corporate Investment Grade (Treasury Rate-Hedged) Index.
The S&P 500 is a benchmark index published by Standard & Poor's (S&P) representing 500 companies with large-cap market capitalizations. The S&P 500 Dividend Aristocrats Index targets companies that are currently members of the S&P 500 that have increased dividend payments each year for at least 25 years. The S&P MidCap 400 is a benchmark index published by Standard & Poor's (S&P) representing 400 companies with mid-cap market capitalizations. The S&P MidCap 400 Dividend Aristocrats Index targets companies that are currently members of the S&P MidCap 400 that have increased dividend payments each year for at least 15 years. The Dow Jones U.S. Select Dividend Index aims to represent the U.S.'s leading stocks by dividend yield. The S&P 500® Value measures constituents from the S&P 500 that are classified as value stocks based on three factors: the ratios of book value, earnings and sales to price. The S&P 500® Equal Weight Index (EWI) is the equal-weight version of the widely-used S&P 500. THESE ENTITIES AND THEIR AFFILIATES MAKE NO WARRANTIES AND BEAR NO LIABILITY WITH RESPECT TO PROSHARES.
This is not intended to be investment advice. Indexes are unmanaged, and one cannot invest directly in an index. Past performance does not guarantee future results.
Any forward-looking statements herein are based on expectations of ProShare Advisors LLC at this time. Whether or not actual results and developments will conform to ProShare Advisors LLC’s expectations and predictions, however, is subject to a number of risks and uncertainties, including general economic, market and business conditions; changes in laws or regulations or other actions made by governmental authorities or regulatory bodies; and other world economic and political developments. ProShare Advisors LLC undertakes no duty to update or revise any forward-looking statements, whether as a result of new information, future events or otherwise.
Investing involves risk, including the possible loss of principal. This information is not meant to be investment advice.
The “S&P 500®,” “S&P MidCap400®,” “S&P 500® Dividend Aristocrats® Index,” and the “S&P MidCap 400® Dividend Aristocrats® Index” are products of S&P Dow Jones Indices LLC and its affiliates and have been licensed for use by ProShare Advisors LLC. "S&P®" is a registered trademark of Standard & Poor’s Financial Services LLC (“S&P”), and “Dow Jones®" is a registered trademark of Dow Jones Trademark Holdings LLC (“Dow Jones”) and they have been licensed for use by S&P Dow Jones Indices LLC and its affiliates. ProShares ETFs based on these indexes are not sponsored, endorsed, sold or promoted by these entities or their affiliates, and they make no representation regarding the advisability of investing in ProShares ETFs. THESE ENTITIES AND THEIR AFFILIATES MAKE NO WARRANTIES AND BEAR NO LIABILITY WITH RESPECT TO PROSHARES.