Key Observations

After DeepSeek and tariff threats upended markets on back-to-back weekends, it might be time for investors to turn off the news, or at least think twice about how it influences their investing decisions.
News matters, of course, but it can change on a dime. Almost as quickly as tariffs were announced, they were delayed. That doesn’t translate into a clear change in the investment landscape, however. It’s true that the risks from tariffs are real and rising, but investors’ choices are less clear. For example, tariffs may increase inflation pressures and send bond yields higher, but they could also dent economic growth, which could bring bond yields down. For fixed income investors, such uncertainty could suggest taking a balanced approach, with a significant allocation to short duration to limit rate risk, but also some exposure to longer-duration bonds that can act as a diversifier with the potential to rise in price if a recession hurts risk assets.
Meanwhile, in equity markets, DeepSeek is here, Nvidia is down and Facebook is up. But, how much did it really cost? Should the answer really change one’s investment strategy? We already knew that concentration risk was high in the S&P 500. We also already had a view that mid-cap stocks could be a prudent path for diversifying that risk—thanks to their long-term home in the equity market’s so-called “sweet spot” between risk and return potential, a position catalyzed by current valuations. Is that perhaps a better focus for our attention?
Chart of the Month
Are Mid-Caps a Bargain and Turning the Corner?
January Performance
2025 Estimated Price-to-Earnings (P/E)
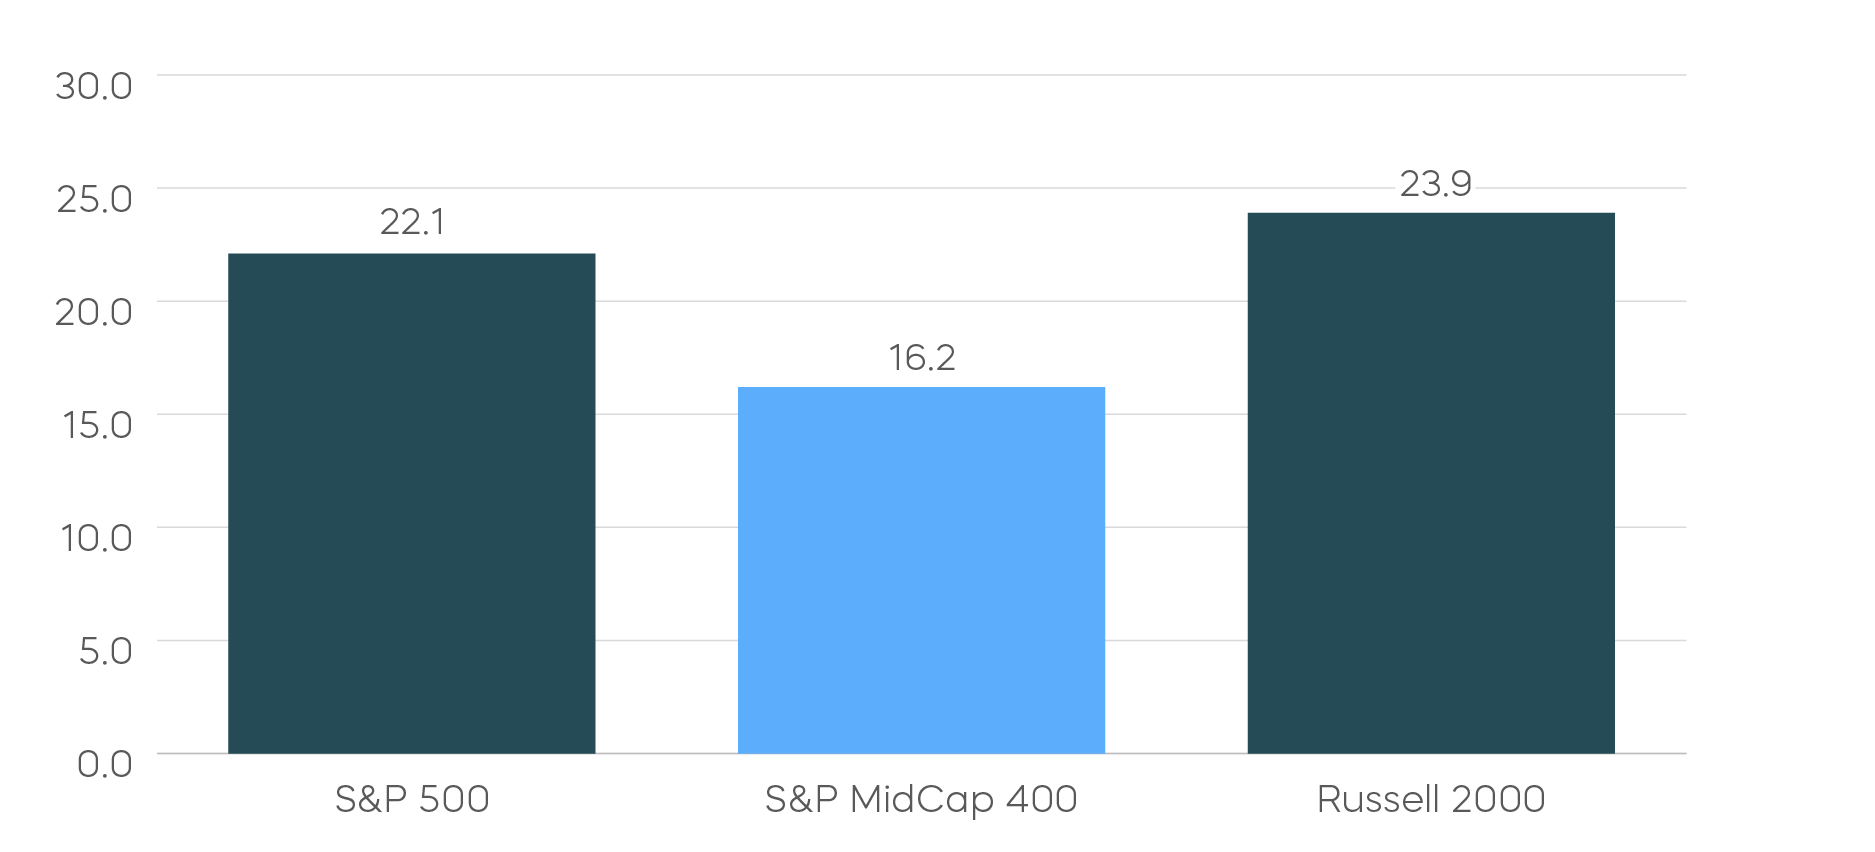
Source: Bloomberg, data as of 2/3/25. Price-to-earnings (P/E) shows how much investors are paying for a dollar of a company's earnings. P/E helps to assess the relative value of a company’s stock by measuring its share price relative to its earnings. Index returns are for illustrative purposes only and do not reflect any management fees, transaction costs or expenses. Indexes are unmanaged, and one cannot invest directly in an index. Past performance does not guarantee future results.
Getting back to the idea of following the news: If watching the news is a catalyst for you making well-considered portfolio changes with an appropriate time horizon, then please, keep watching. But, if the news is a temptation that turns you into more of a short-term trader than the long-term investor you would prefer to be, maybe it’s time to change the channel.
Performance Recap
Global stocks and bonds posted broad gains in January, with developed international markets leading the way. In the United States, mid-cap stocks emerged as the new market leaders, outperforming both large-cap and small-cap stocks. Additionally, the equal-weighted S&P 500 index outperformed its market-cap weighted counterpart as the information technology sector registered losses during the month.
Asset Class Returns—January 2025 (YTD)
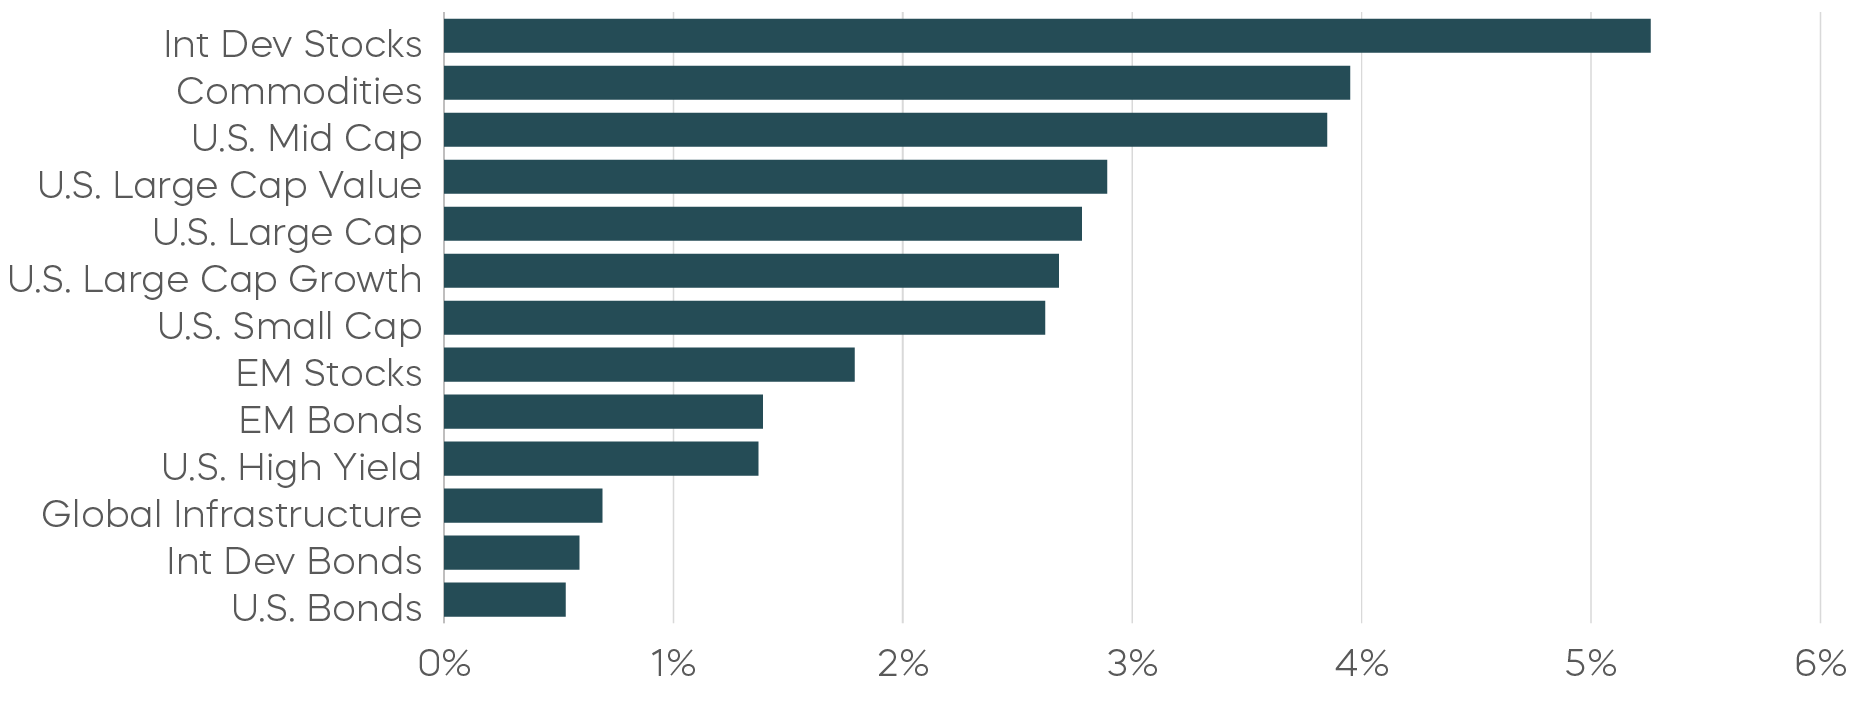
Source: Bloomberg. January/YTD returns 1/1/25–1/31/25. Index returns are for illustrative purposes only and do not reflect any management fees, transaction costs or expenses. Indexes are unmanaged, and one cannot invest directly in an index. Past performance does not guarantee future results.
Economic Calendar
Here is a list of key and upcoming economic releases, which may serve as a guide to potential market indicators.
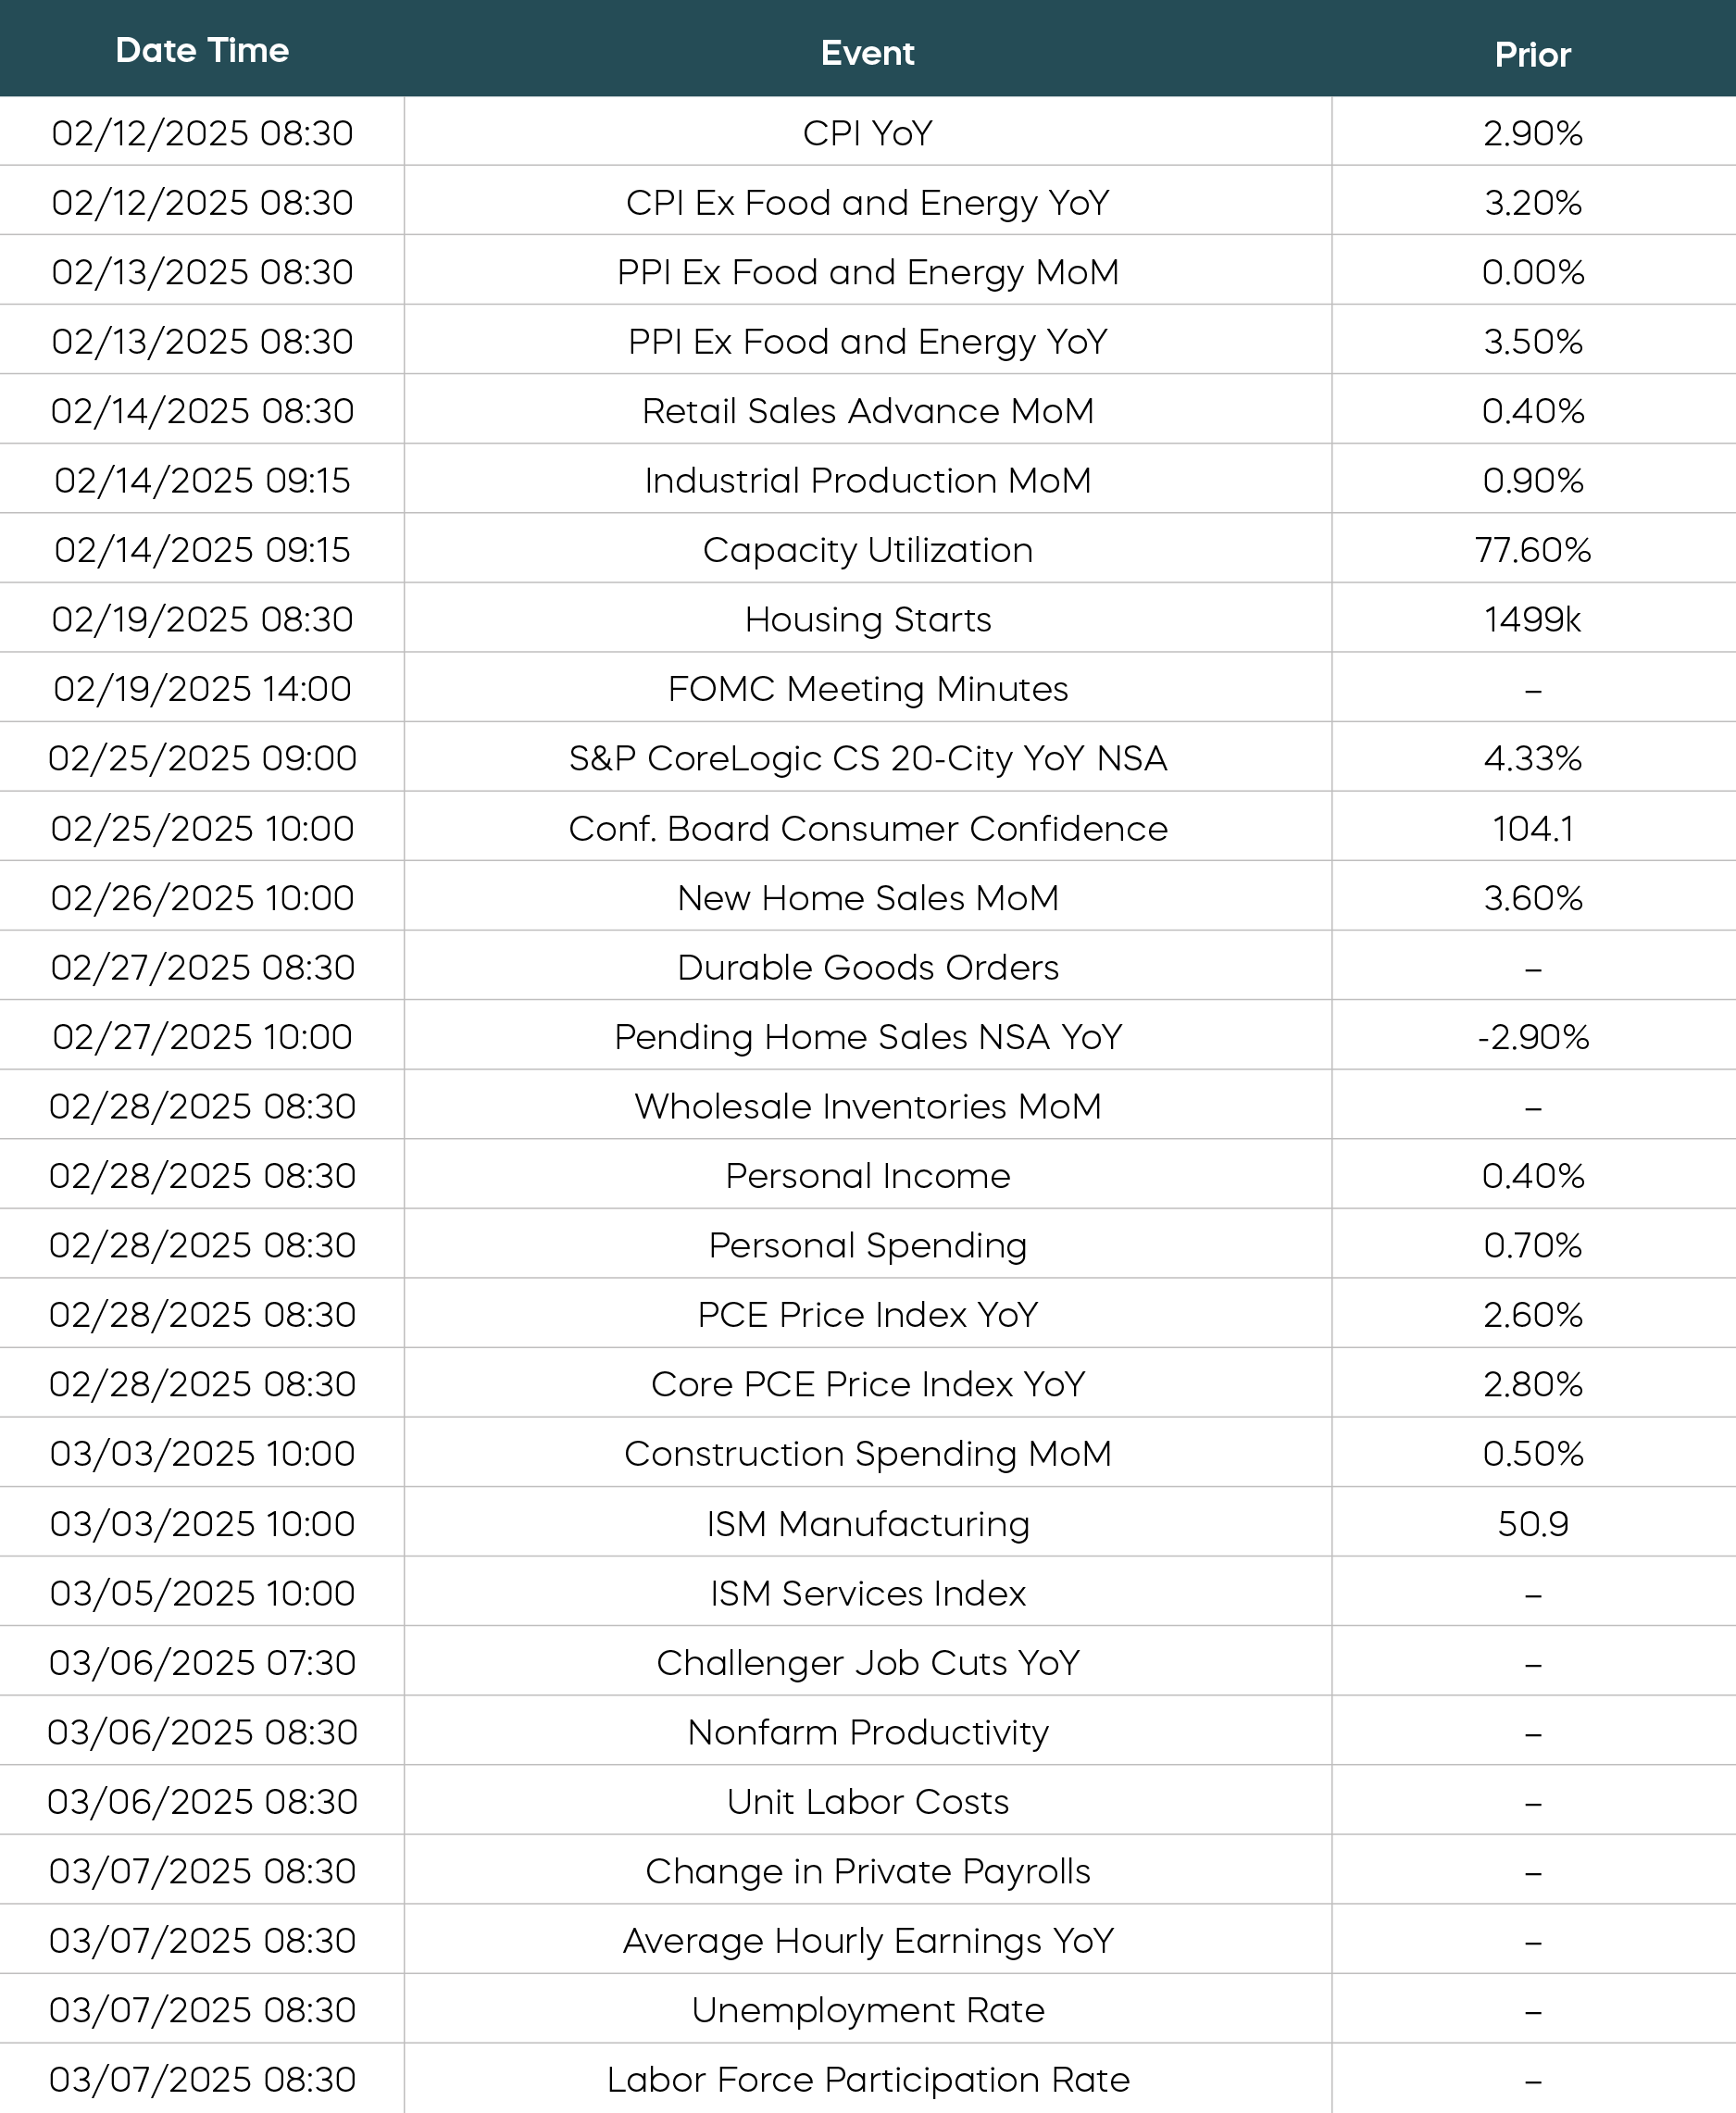
Source: Bloomberg. Data is as of 2/3/25.
Equity Perspectives

The January Effect
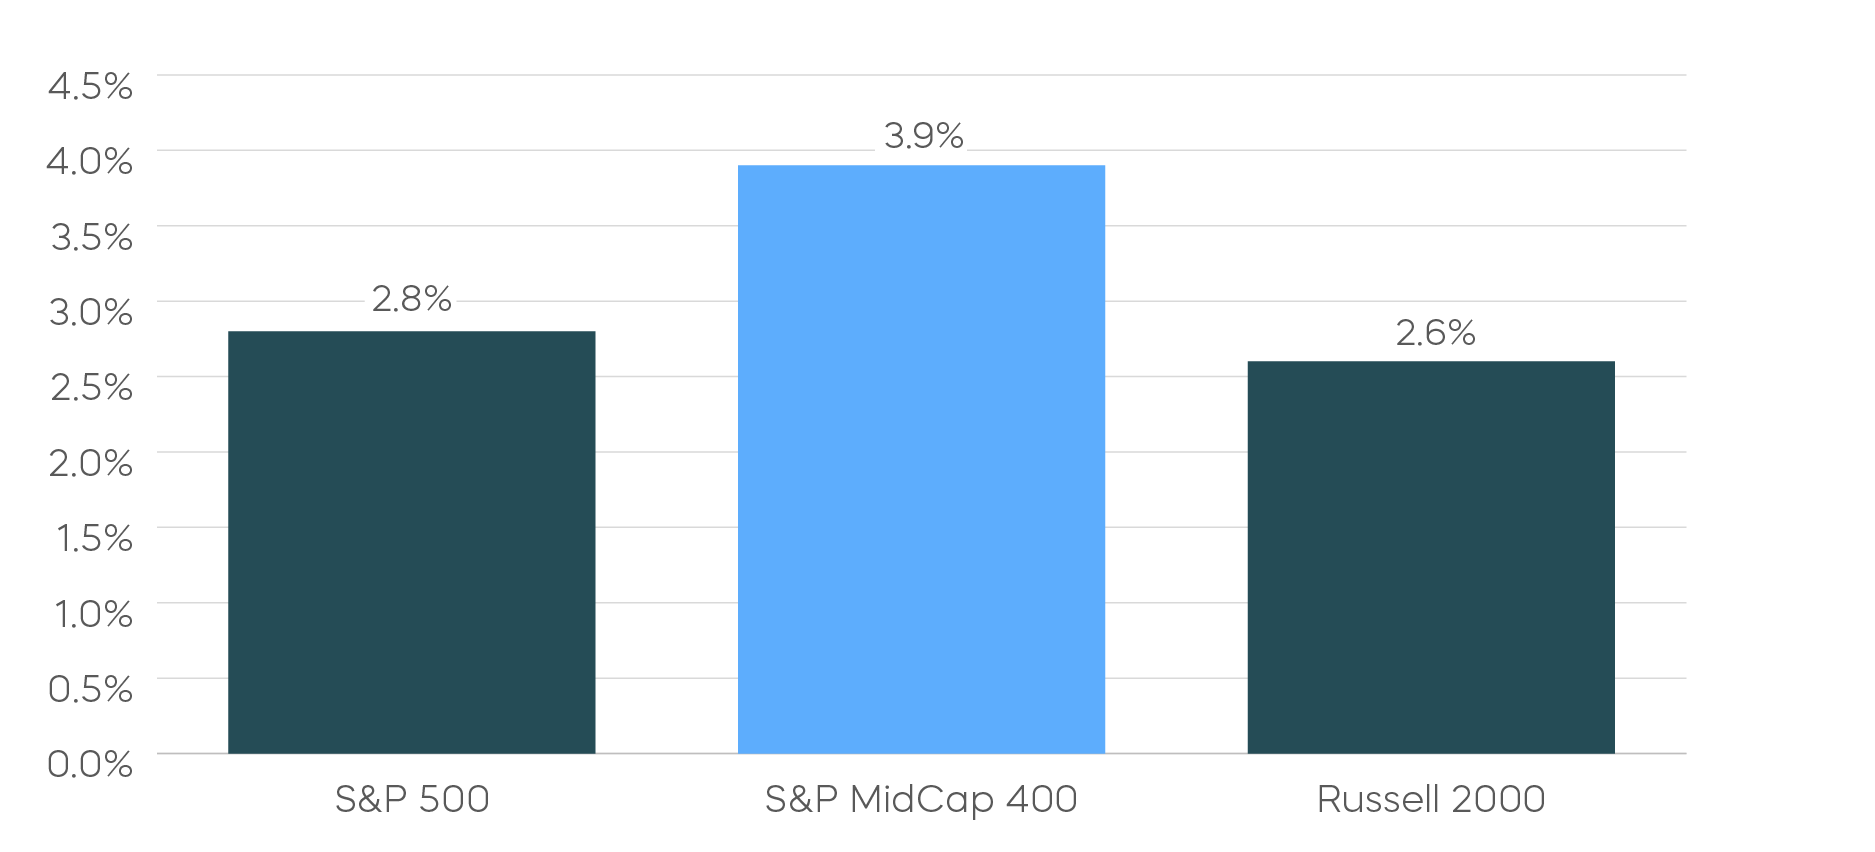
The January Effect is the notion that stocks tend to rise by a greater amount during the first month of the year compared with other months. Another indicator known as the January Indicator offers the idea that, as January goes, so goes the rest of the year. According to Bespoke Investment Group, when the S&P 500 is higher in January, the median rest-of-year performance is 13.5%. While academics may question their statistical significance, both of these concepts give reason for the optimists among us to remain constructive. Stocks across most market segments delivered gains in January. The S&P 500 rose nearly 3%, and the S&P MidCap 400 delivered returns of almost 4%.
How to Generate Income Not Correlated with Interest Rates
One marker that seems difficult to gauge these days is the direction of yields. With the Federal Reserve on hold and the U.S. 10-year yield ending the month slightly down, ongoing rate uncertainty continues to challenge income investors. On one hand, rates moving higher exposes fixed income investors who own duration risk to near-term losses. On the other hand, falling rates could mean lower income over time. Assets designed to produce income from equities may provide a solution by providing income that is not correlated with interest rates.
A covered call strategy like the S&P 500 Daily Covered Call Index uses daily rather than monthly options, and as we have seen, it has the potential to deliver annualized yields of approximately 10% (Source: Bloomberg, as of 1/31/25). In addition, the strategy targets the returns of the S&P 500, meaning investors can potentially capture longer-term returns that traditional monthly covered call strategies have historically sacrificed.
Covered Call Strategies Using Daily Options Have Captured Returns that Traditional Strategies Haven't
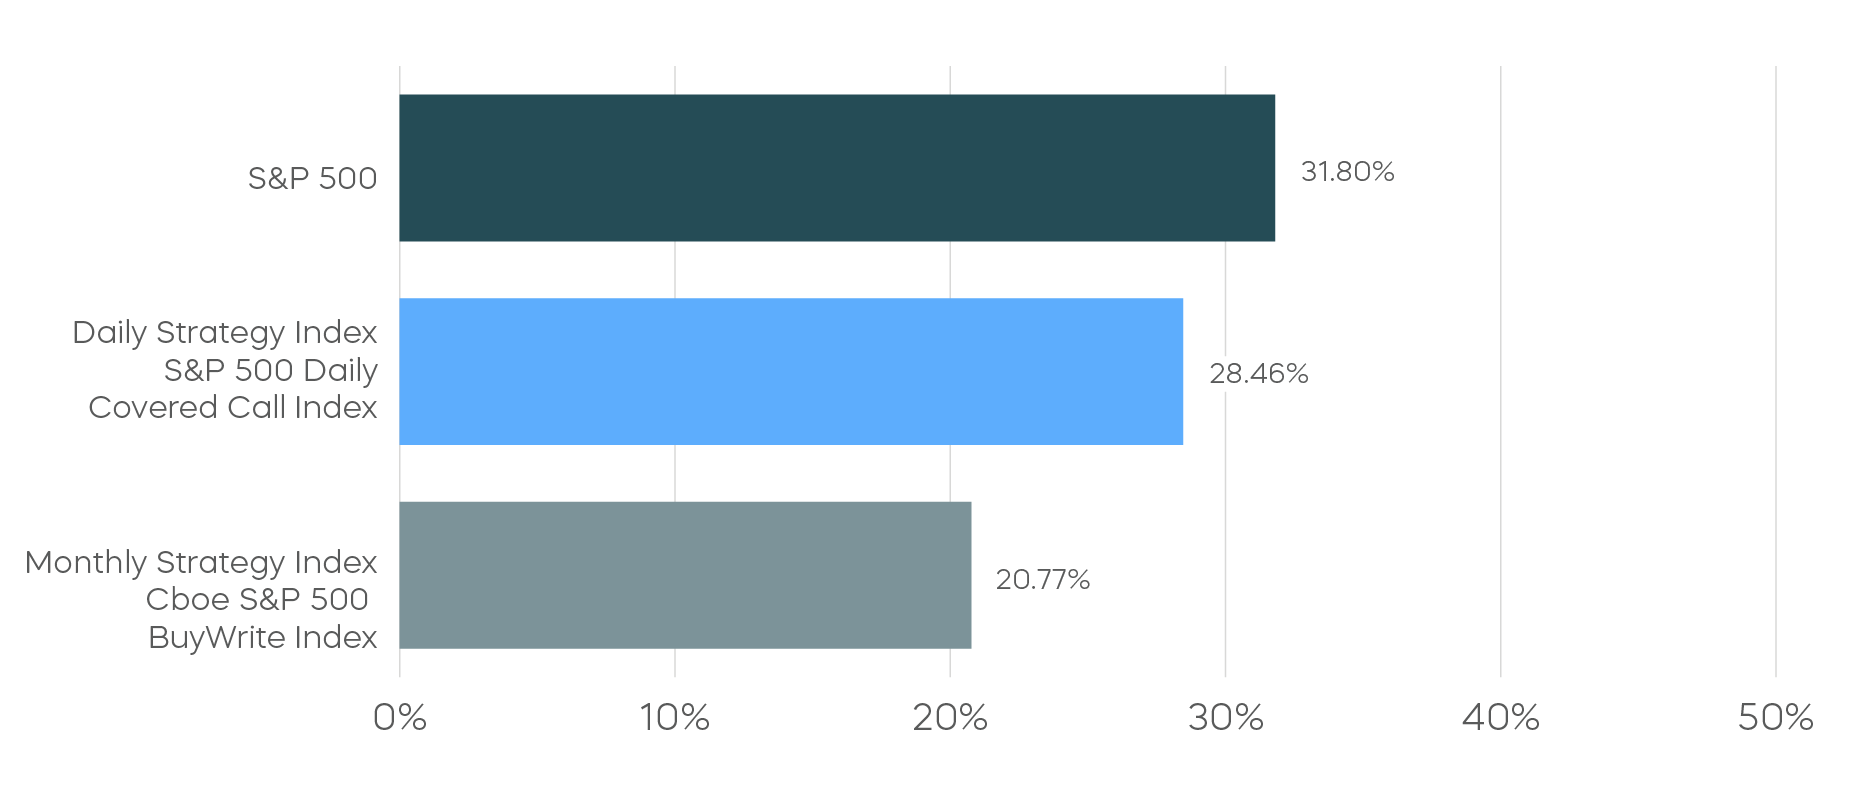
Source: Bloomberg, index data since inception of daily covered call index 10/5/23–1/31/25 (annualized). Daily covered call indexes have very limited performance history, which should not be taken as an indication of future performance. Index returns are for illustrative purposes only and do not represent actual fund performance. Index returns do not reflect any management fees, transaction costs or expenses. Indexes are unmanaged and one cannot invest directly in an index. Past performance does not guarantee future results.
Mid-Caps Represent a Compelling Equity Opportunity Insulated from Tariffs
As part of our 2025 Market Outlook, we noted the expectation that market participation would broaden beyond the large-cap technology and momentum stock dominance that has defined the current bull market. Evidence of this shift emerged in mid-2024, as smaller capitalization stocks began to outperform growth and technology stocks. Now, DeepSeek’s sudden emergence as a potentially less expensive artificial intelligence competitor seems to further highlight investors’ potentially warranted apprehension about the pricey and highly concentrated large-cap strategies currently powering their portfolios. Many are thinking: “Time to diversify.”
Mid-cap stocks could be a compelling opportunity in 2025. Since 1991, the S&P MidCap 400 has not only outperformed the S&P 500 but done so consistently, outperforming large caps in over 75% of rolling 10-year periods (Source: Bloomberg, as of 1/31/25). Currently trading at roughly 60% of the S&P 500 on a trailing twelve-month price-to-earnings basis, and with an expected 14% earnings growth rate, mid-caps arguably offer a better fundamental outlook than large caps (Source: Bloomberg and FactSet, as of 1/31/25). High quality mid-caps, like the S&P MidCap 400 Dividend Aristocrats, each of which has grown its dividends for at least 15 consecutive years, are especially worthy of note, as the Dividend Aristocrats have generally delivered an attractive all-weather performance profile over time.
Other timely reasons for considering mid-caps are the recent developments around tariffs. While the situation will likely remain fluid, investors have been fretting over the potential implications of a trade war bringing some combination of higher prices for consumers and lower corporate profits.
Mid-cap stocks—and the S&P MidCap 400 Dividend Aristocrats in particular—are largely shielded from the noise around tariffs, as the majority of their revenues are generated domestically. In contrast, roughly 40% of S&P 500 revenues are sourced offshore, potentially exposing those companies to further headwinds.
Percentage of Revenues Sourced from Within the United States

Source: FactSet, based on company revenue data as of 1/31/25.
Fixed Income Perspectives

The yield curve remained largely unchanged in January despite a brief run-up in long-term Treasury yields at the start of the year. High yield corporate bonds outperformed, as spreads tightened to previous lows after widening at the end of last year. Break-even inflation rates increased during the month, boosting the total returns of TIPS.
Fixed Income Returns—January 2025 (YTD)
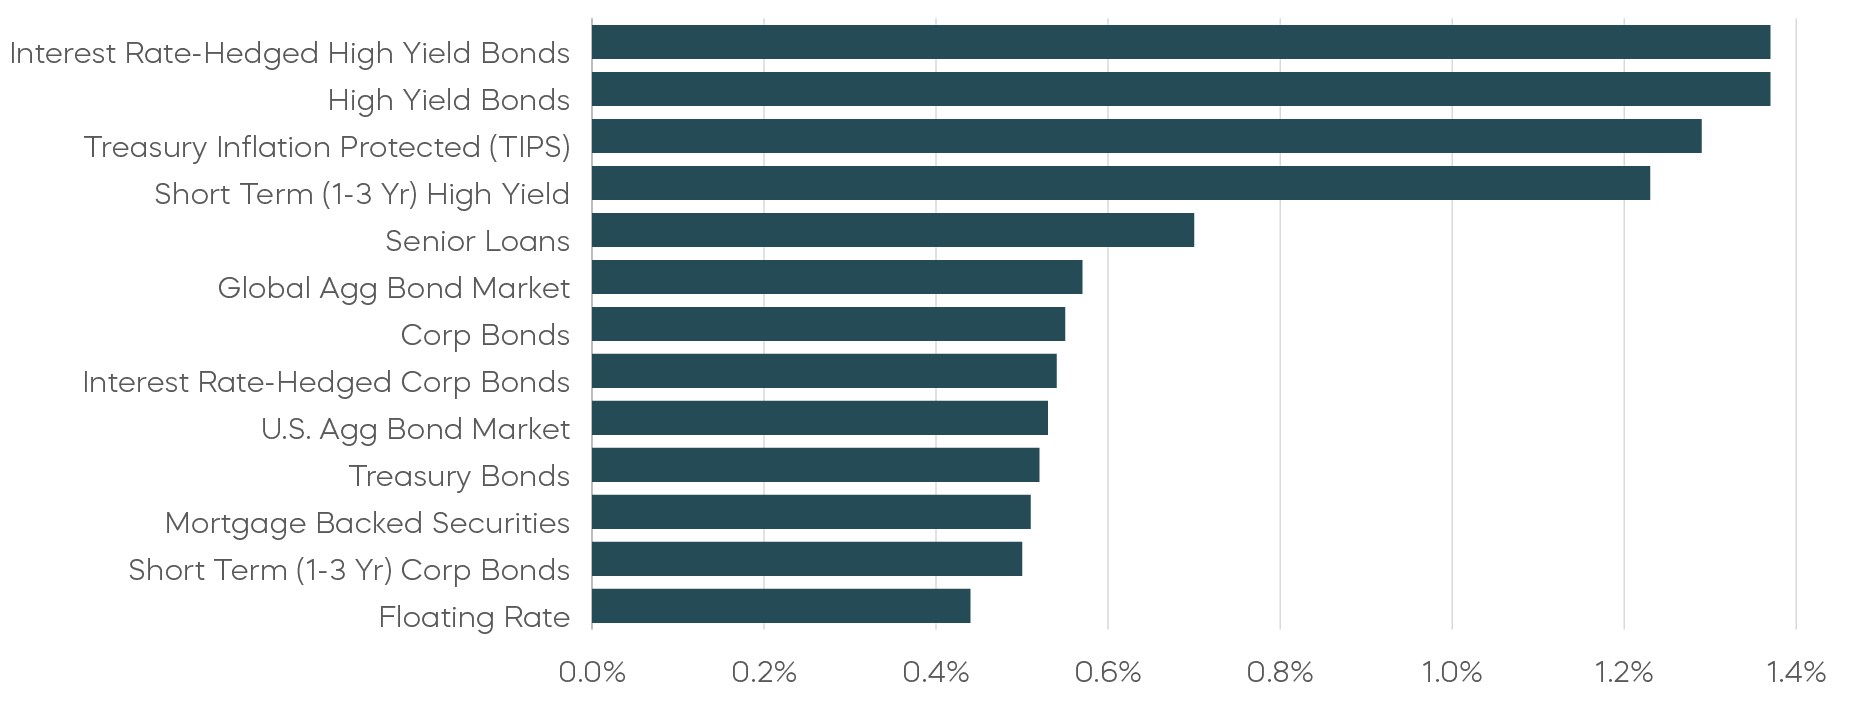
Source: Bloomberg. January/YTD returns 1/1/25–1/31/25. Index returns are for illustrative purposes only and do not reflect any management fees, transaction costs or expenses. Indexes are unmanaged, and one cannot invest directly in an index. Past performance does not guarantee future results.
Tariffs and Inflation: A Renewed Test for Investors
February kicked off with a jolt, as President Trump threatened across-the-board tariffs on imports from Canada, Mexico and China. As the top trading partners with the United States, these three countries make up over 40% of total U.S. imports (Source: Bureau of Economic Analysis, 2024). While inflation risks tied to trade policy have long been a “known unknown,” markets reacted with a familiar bout of volatility. The initial response saw the yield curve flatten and near-term breakeven inflation rates climb, signaling an increase in inflation expectations. Although the tariffs on Mexico and Canada have been delayed for a month, they remain a key risk for higher inflation.
Until now, investors seemed to view the tariff threat much like they have in the past—as a negotiating tool, rather than a lasting policy shift. A similar playbook unfolded in May 2019, when Trump announced multi-stage tariffs on Mexico, only to suspend them after securing concessions on immigration enforcement. This time around, skepticism remains.
Most investors view tariffs as a blunt economic instrument. Projections suggest that new tariffs on Canada and Mexico could raise $110 billion in revenue by 2025, falling to $75 billion by 2035—a drop in the bucket compared to federal tax receipts from income and corporate taxes (Source: Urban & Brookings Tax Policy Center, January 2025). In addition, while tariffs are often framed as a way to restore and protect domestic manufacturing, in reality, higher input costs and a stronger dollar can undermine domestic producers rather than support them.
Businesses are signaling their own doubts. In past trade disputes, firms scrambled to stockpile inventory ahead of tariff hikes—most recently when U.S. importers rushed to secure electric vehicle batteries before new tariffs under the Biden administration. And during Trump’s first term, companies ramped up imports in 2018 ahead of escalating tariffs on $200 billion worth of Chinese goods. This time, businesses have been noticeably slower to react, despite Trump making his intentions for broad tariffs clear. Fourth-quarter GDP data showed net exports contributing positively to growth, suggesting no rush on the part of businesses to front-load imports.
For fixed income investors, a key takeaway is that markets could be underestimating the potential impact of tariffs—especially if they evolve into a longer-term protectionist stance. If tariffs are not fully priced in, market expectations could shift suddenly, raising inflation expectations and driving interest rates higher. Given Trump's track record with tariffs, ongoing tensions could once again inject volatility into interest rates as investors adjust to new trade realities.
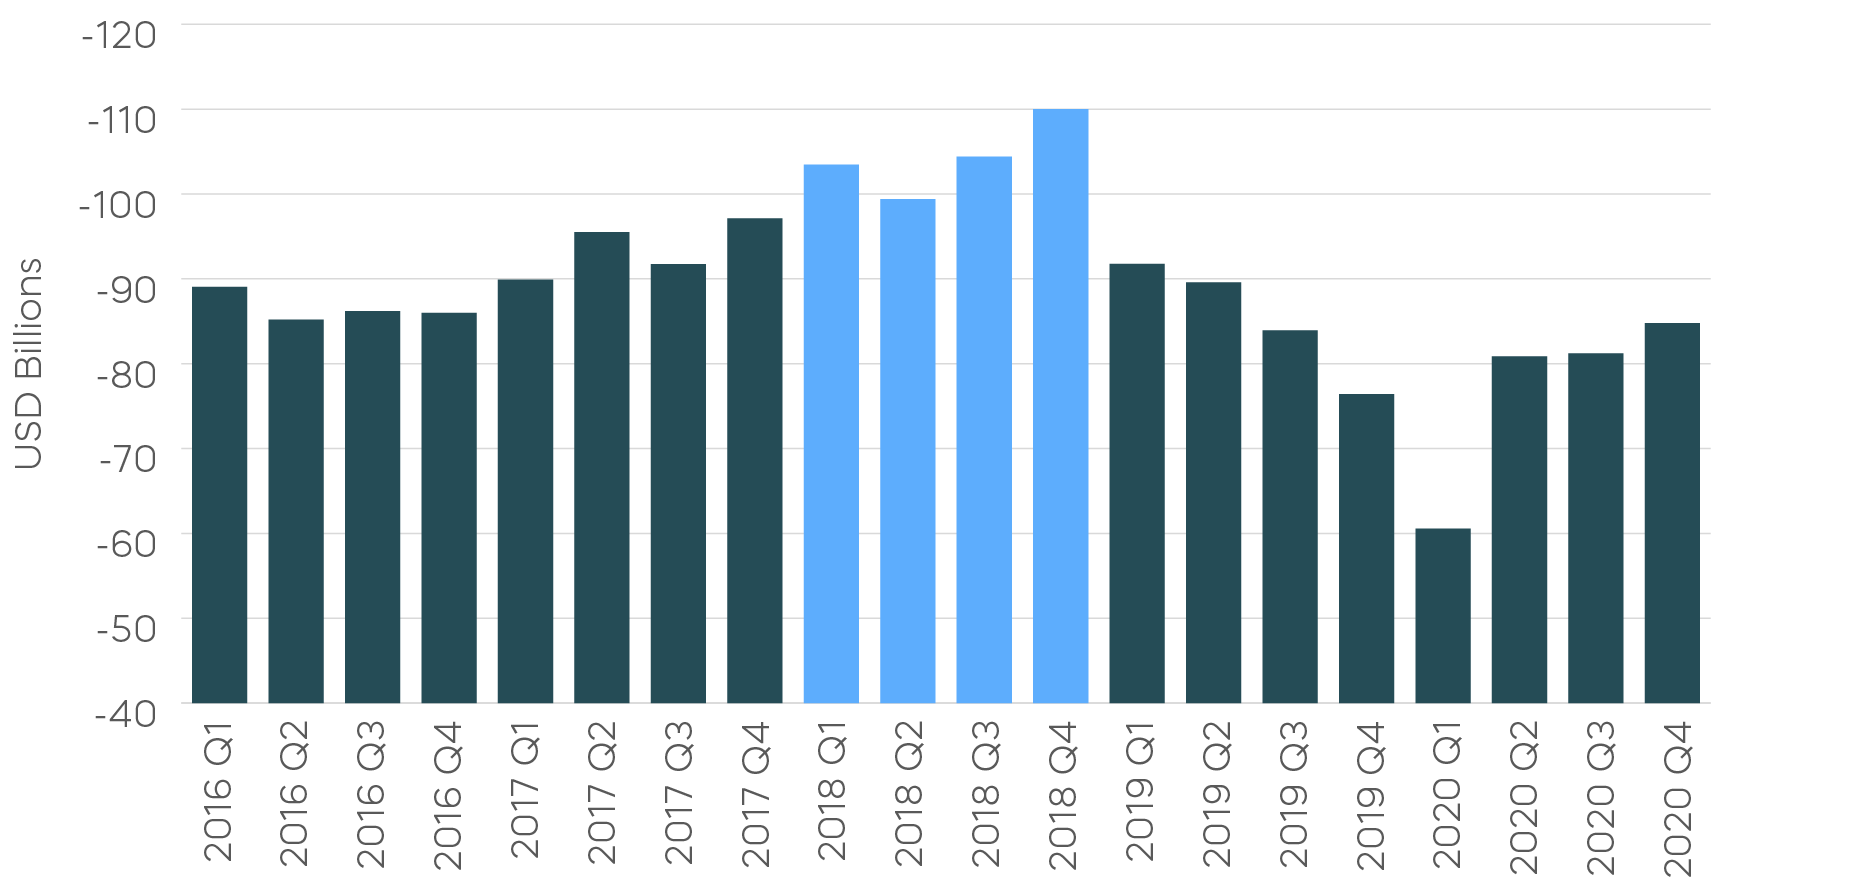
U.S.-China Trade Balance on Goods
U.S. Imports in Goods by Countries
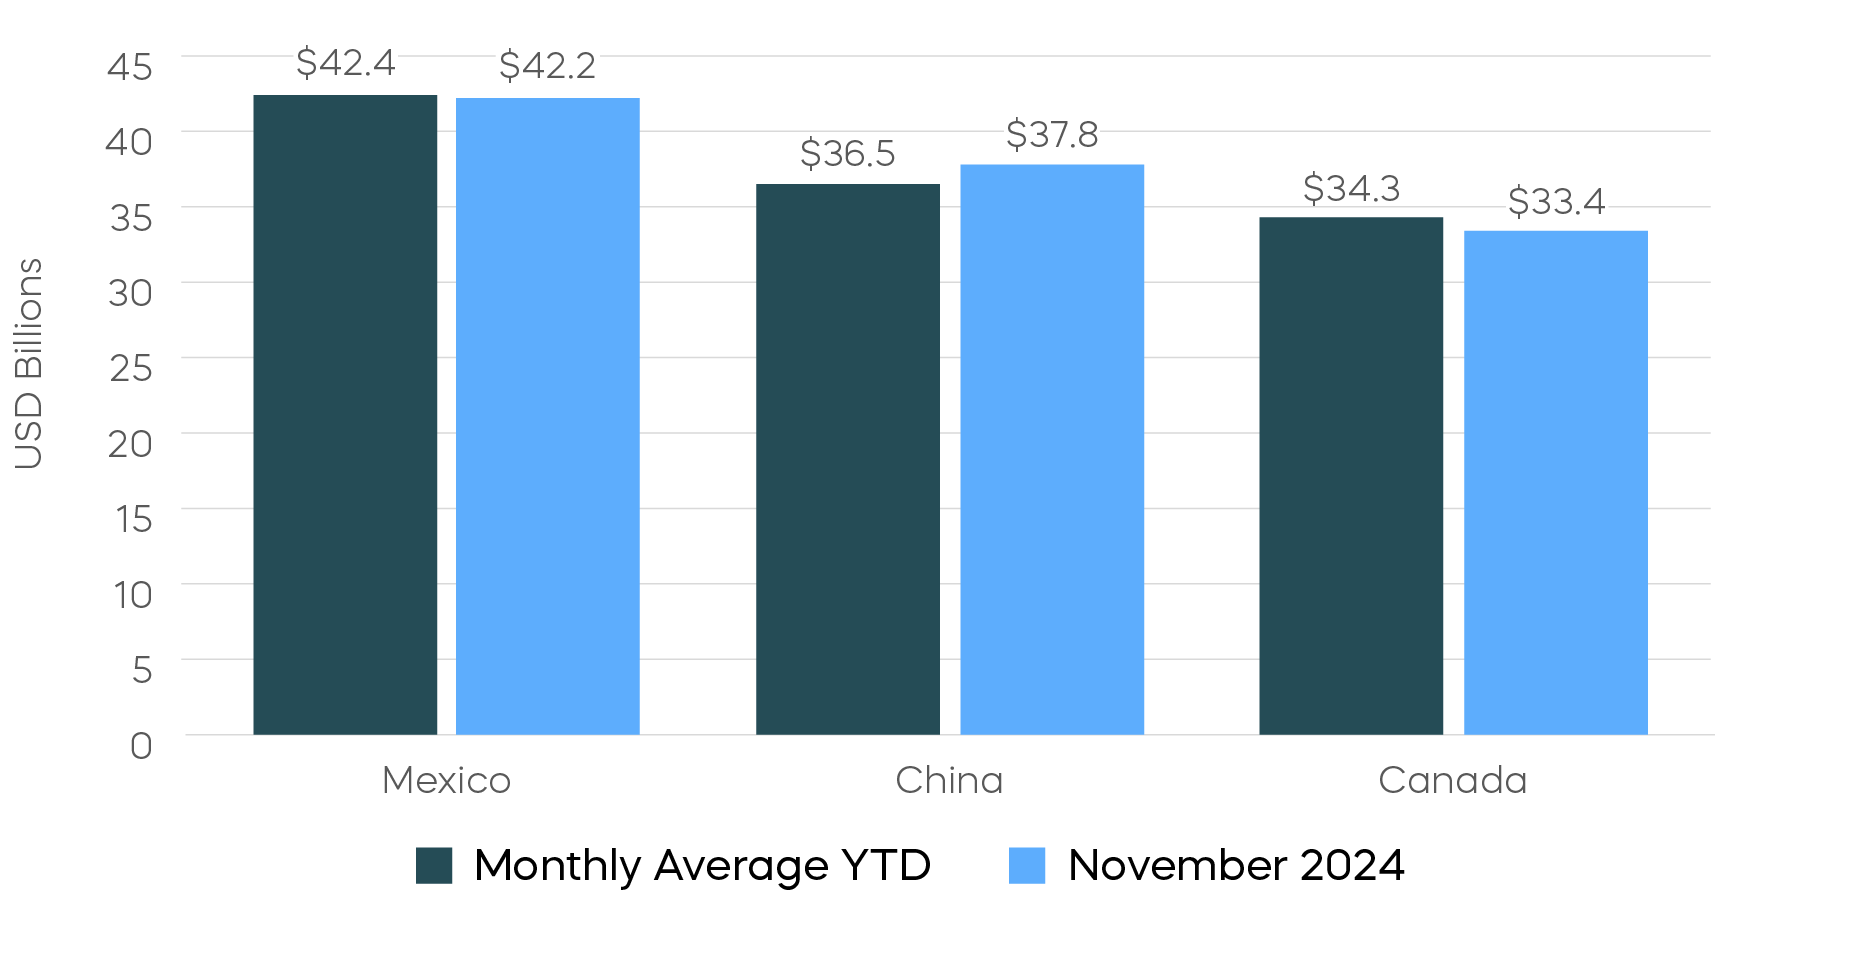
Source: Bureau of Economic Analysis, U.S. International Trade in Goods and Services, November 2024.
Sources for data and statistics: Bloomberg, FactSet, Morningstar, and ProShares.
The different market segments represented in the performance recap charts use the following indexes: U.S. Large Cap: S&P 500 TR; U.S. Large Cap Growth: S&P 500 Growth TR; U.S. Large Cap Value: S&P 500 Value TR; U.S. Mid Cap: S&P Mid Cap TR; U.S. Small Cap: Russell 2000 TR; International Developed Stocks: MSCI Daily TR NET EAFE; Emerging Markets Stocks: MSCI Daily TR Net Emerging Markets; Global Infrastructure: Dow Jones Brookfield Global Infrastructure Composite; Commodities: Bloomberg Commodity TR; U.S. Bonds: Bloomberg U.S. Aggregate; U.S. High Yield: Bloomberg Corporate High Yield; International Developed Bonds: Bloomberg Global Agg ex-USD; Emerging Market Bonds: DBIQ Emerging Markets USD Liquid Balanced.
The different market segments represented in the fixed income returns charts use the following indexes: Global Agg Bond Market: Bloomberg Global-Aggregate Total Return Index Value Unhedged USD; Mortgage Backed Securities: Bloomberg U.S. MBS Index Total Return Value Unhedged USD; Treasury Bonds: Bloomberg U.S. Treasury Total Return Unhedged USD; U.S. Agg Bond Market: Bloomberg U.S. Agg Total Return Value Unhedged USD; Corporate Bonds: Bloomberg US Corporate Total Return Value Unhedged USD; High Yield Bonds: Bloomberg U.S. Corporate High Yield Total Return Index Value Unhedged USD; Interest Rate-Hedged High Yield Bonds: FTSE High Yield (Treasury Rate-Hedged) Index; Treasury Inflation Protected (TIPS): Bloomberg U.S. Treasury Inflation Notes TR Index Value Unhedged USD; Short term (1-3 Yr) High Yield: Bloomberg U.S. Corporate 0-3 Year Total Return Index Value Unhedged USD; Senior Loans: Morningstar LSTA U.S. Leveraged Loan 100 Index; Short term (1-3 Yr) Corp Bonds: Bloomberg U.S. Corporate 1-3 Yr Total Return Index Value Unhedged USD; Floating Rate: Bloomberg U.S. FRN < 5 yrs Total Return Index Value Unhedged USD; Interest Rate-Hedged Corporate Bonds: FTSE Corporate Investment Grade (Treasury Rate-Hedged) Index.
The S&P 500 is a benchmark index published by Standard & Poor's (S&P) representing 500 companies with large-cap market capitalizations. The S&P 500 Daily Covered Call Index seeks to measure the performance of a long position in the S&P 500 TR and a short position in a standard S&P 500 daily call option, aiming to reflect higher income generation and lower timing risk by using daily options versus monthly options. The S&P MidCap 400 is a benchmark index published by Standard & Poor's (S&P) representing 400 companies with mid-cap market capitalizations. The S&P MidCap 400 Dividend Aristocrats Index targets companies that are currently members of the S&P MidCap 400 that have increased dividend payments each year for at least 15 years. The Russell 2000 Index is a small-cap U.S. stock market index that makes up the smallest 2,000 stocks in the Russell Index. The CBOE S&P 500 BuyWrite Index is a benchmark designed to show the hypothetical performance of a portfolio that engages in a buy-write strategy using S&P 500 call options. THESE ENTITIES AND THEIR AFFILIATES MAKE NO WARRANTIES AND BEAR NO LIABILITY WITH RESPECT TO PROSHARES.
This is not intended to be investment advice. Indexes are unmanaged, and one cannot invest directly in an index. Past performance does not guarantee future results.
Any forward-looking statements herein are based on expectations of ProShare Advisors LLC at this time. Whether or not actual results and developments will conform to ProShare Advisors LLC’s expectations and predictions, however, is subject to a number of risks and uncertainties, including general economic, market and business conditions; changes in laws or regulations or other actions made by governmental authorities or regulatory bodies; and other world economic and political developments. ProShare Advisors LLC undertakes no duty to update or revise any forward-looking statements, whether as a result of new information, future events or otherwise.
Investing involves risk, including the possible loss of principal. This information is not meant to be investment advice.
The “S&P 500®,” “S&P MidCap400,” “S&P 500 Daily Covered Call Index,” “S&P MidCap 400® Dividend Aristocrats® Index,” and “S&P 500 Daily Covered Call Index” are products of S&P Dow Jones Indices LLC and its affiliates and have been licensed for use by ProShare Advisors LLC. "S&P®" is a registered trademark of Standard & Poor’s Financial Services LLC (“S&P”), and “Dow Jones®" is a registered trademark of Dow Jones Trademark Holdings LLC (“Dow Jones”) and they have been licensed for use by S&P Dow Jones Indices LLC and its affiliates. FTSE Russell is a trading name of certain of the LSE Group companies. ProShares ETFs based on these indexes are not sponsored, endorsed, sold or promoted by these entities or their affiliates, and they make no representation regarding the advisability of investing in ProShares ETFs. THESE ENTITIES AND THEIR AFFILIATES MAKE NO WARRANTIES AND BEAR NO LIABILITY WITH RESPECT TO PROSHARES.