Is There a Better Way to Earn Income from Equities?
There are many approaches investors can take when seeking income from their equity holdings. But they generally fall into one of two main categories: high-yielding equity and derivative strategies.
- High-yielding equity strategies generate income, but they can also lead investors to “stretch for yield,” or turn to narrow slices of the equity market such as utilities, REITs, MLPs and closed-end funds.
- Derivative strategies, like options, swaps, and futures or forward contracts, can also generate income from equities—with covered call approaches the most popular by far.
So, what’s the problem? Both high-yielding equity and derivative strategies have a record of delivering attractive levels of income, but they also generally earn their income at the expense of total return (i.e., sacrificing upside). This can compromise an investor’s equity allocation and its ability to achieve long-term performance objectives.
A compelling solution could be the combination of quality dividend growth stocks with a daily covered call strategy. This combined strategy can provide a way for investors to avoid the drawbacks of traditional equity income strategies, potentially improving long-term total returns.
Before we more fully explore that combination, let’s review where traditional approaches have let investors down.
High Dividend Strategies Compromise Total Return
“What’s the yield?” That is often the first question investors ask when seeking equity income opportunities. The immediate gratification of high-yield income is tempting. But it is also only one component of total return—a significant part being capital appreciation, which high-yield stocks often sacrifice. To attract investors, companies with high dividend yields frequently pay dividends at levels that make it difficult to reinvest in the business, sacrificing potential growth as a result.
The quest for high yield can also lead investors into narrow slices of the equity market that bring increased risks. Income strategies that use simple screens for high dividend yield frequently result in portfolios that overweight sectors like utilities. REITs and MLPs are also popular avenues for seeking high yield, but these niche asset classes are often cyclical and have weak long-term performance. Closed-end funds use a variety of strategies, but also have a less than stellar track record. Let’s compare the longer-term performance of these strategies to the S&P 500 using common benchmarks.
High Yield Equity Strategies Underperform Over the Long Term
10-Year Performance
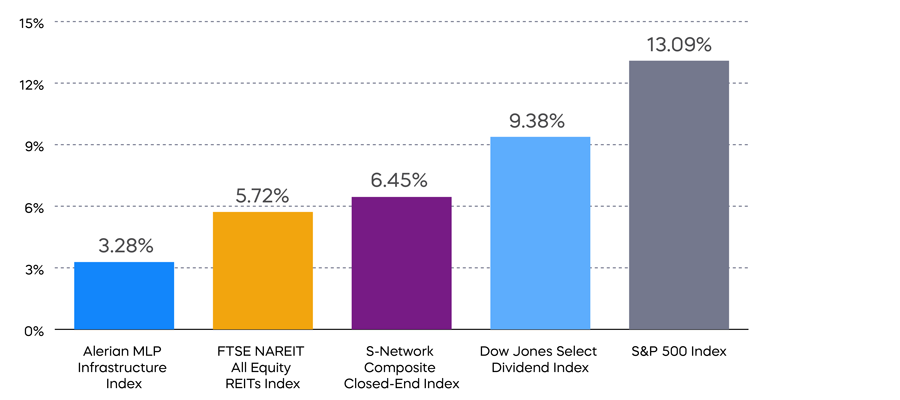
Source: Bloomberg. Data from 5/31/14 to 12/31/24. The Alerian MLP Infrastructure Index is a composite of energy infrastructure master limited partnerships (MLPs). The S-Network Composite Closed-End Fund Index is designed to serve as a benchmark for closed-end funds listed in the U.S. that are principally engaged in asset management processes designed to produce taxable annual yield. The FTSE NAREIT All Equity REITs Index contains all tax-qualified REITs with more than 50 percent of total assets in qualifying real estate assets other than mortgages secured by real property that also meet minimum size and liquidity criteria. The Dow Jones U.S. Select Dividend Index screens stocks by dividend per share growth rate, dividend payout percentage rate, and average daily dollar trading volume, and stocks are selected based on dividend yield. Index returns are for illustrative purposes only and do not represent actual Fund performance. Index returns do not reflect any management fees, transaction costs or expenses. Indexes are unmanaged and one cannot invest directly in an index. Past performance does not guarantee future results.
The Covered Call Conundrum Limits Upside
Covered call strategies make the trade-off between income and returns more explicit. An investor typically accepts a ceiling or cap on the appreciation of their investment in exchange for income from the sale of a call option. This cap creates an inherent long-term trade-off: high income for reduced long-term upside return potential.
With traditional covered call strategies that use monthly call options, this trade-off becomes particularly costly. The following chart shows a performance comparison between the S&P 500 and the CBOE S&P 500 BuyWrite Index, which measures the performance of a monthly covered call strategy on the S&P 500. As you can see, returns from the S&P 500 nearly tripled the monthly covered call strategy.
Monthly Covered Call Strategies Have Sacrificed Two-Thirds of Potential Returns
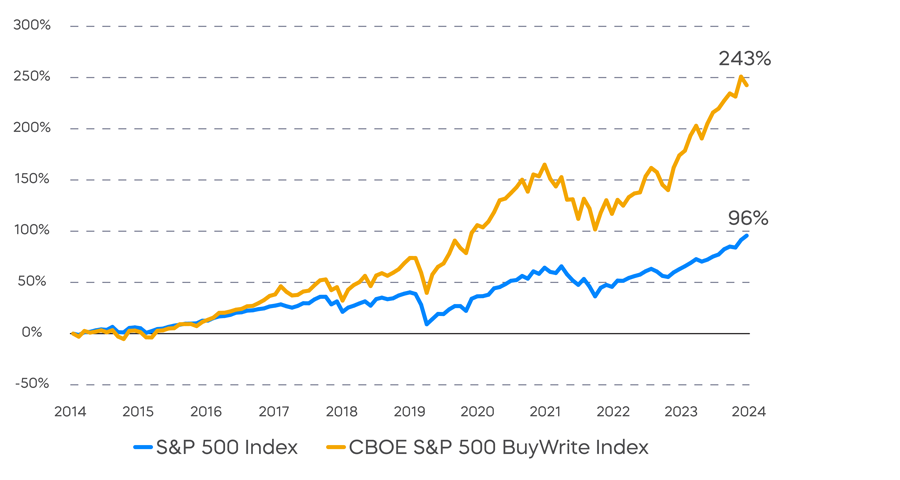
Source: Bloomberg. Monthly returns from 12/31/13 to 12/31/24. Index returns are for illustrative purposes only and do not represent actual fund performance. Index returns do not reflect any management fees, transaction costs or expenses. Indexes are unmanaged, and one cannot invest directly in an index. Past performance does not guarantee future results.
Why does the performance of traditional, monthly covered call strategies seem to lag so badly? It’s actually a simple diagnosis (with no remedy available until recently): when the price of the stock index rises and stays above the strike price early in the month, a monthly covered call strategy will miss out on market rallies for days or even weeks until the call option expires. This is a structural drawback that can cost investors significant long-term total return potential.
The Daily Covered Call Innovation
A daily covered call strategy has the high-income potential of monthly strategies, but is designed to overcome the total return lag by selling daily call options. Using daily options resets the cap on returns each day, enabling the strategy to participate in market rallies and asset appreciation up to the daily strike price. Additionally, selling call options each day serves to rebalance the strategy between premiums and payouts.
Taken together, daily appreciation potential and the better balance between premiums and payouts means that a daily covered call strategy can seek high income, target equity market performance over the long term, and potentially capture returns that monthly strategies usually sacrifice.
While the daily covered call strategy is still relatively new—the S&P 500 Daily Covered Call Index only launched in October 2023—the early returns are compelling. The results seem to demonstrate the strategy’s potential to capture upside more effectively than the monthly option counterpart:
Daily Covered Call Strategies Have Delivered Promising Total Returns
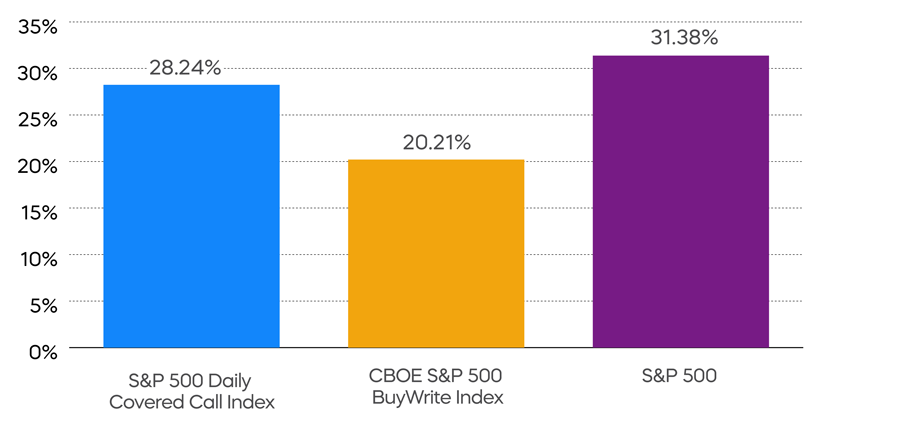
ISPY Total Return Since Inception—12/18/23[1]
As of 12/31/24: 21.66% (NAV) | 21.71% (Market Price)
The performance quoted represents past performance and does not guarantee future results. Investment return and principal value of an investment will fluctuate so that an investor's shares, when sold or redeemed, may be worth more or less than the original cost. Shares are bought and sold at market price (not NAV) and are not individually redeemed from the fund. Market price returns are based upon the midpoint of the bid/ask spread at 4:00 p.m. ET (when NAV is normally determined for most funds). Your brokerage commissions will reduce returns. Current performance may be lower or higher than the performance quoted. For standardized returns and performance data current to the most recent month end, see the Performance page.
ISPY gains exposure to the sale of daily call options using swap agreements and does not trade options.
Source: Bloomberg. Data from 10/5/23 to 5/31/24. Index returns are for illustrative purposes only and do not reflect any management fees, transaction costs or expenses. Indexes are unmanaged, and one cannot invest directly in an index. Past performance does not guarantee future results.
What about a daily covered call strategy’s yield potential? The S&P 500 Daily Covered Call Index’s annualized distribution rate since inception on 10/5/2023 through 5/31/2024 was 11.45%. It is important to note, however, that a daily covered call strategy’s option premium income will vary based on expectations of stock market volatility and other factors over time.[2]
The Power of Dividend Growth
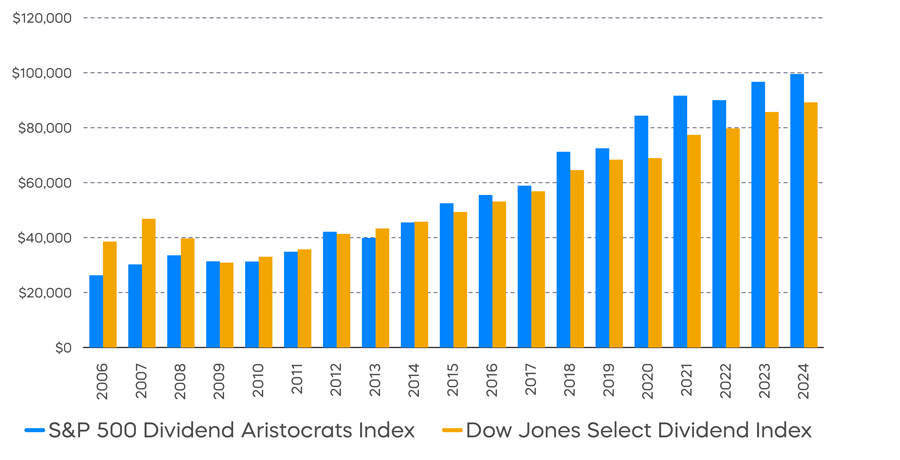
On the other hand, a dividend growth strategy invests in companies that consistently raise their dividend. The S&P 500 Dividend Aristocrats Index, for example, tracks high-quality companies that have grown their dividends for at least 25 consecutive years.
While their initial yields may be lower, companies like the Dividend Aristocrats generally have a better balance of growth and income. As a result, they have delivered greater total returns over time.
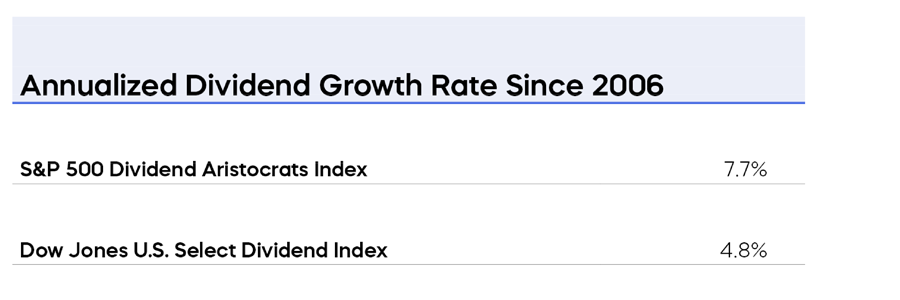
Importantly, dividend growth strategies make up for their lower initial dividend yields with impressive growth of their dividends over time. The dividends of the S&P 500 Dividend Aristocrats Index have grown nearly twice as fast as the dividends of the Dow Jones U.S. Select Dividend Index, a common high-dividend benchmark. As a result, dividend growth has delivered not only superior total returns, but greater levels of income over time as well.
The Aristocrats Have Grown Their Dividends More and at a Higher Rate
Source: Bloomberg. Data as of 12/31/24. Trailing 12-month dividend value. Index returns are for illustrative purposes only and do not represent actual Fund performance. Index returns do not reflect any management fees, transaction costs or expenses. Indexes are unmanaged and one cannot invest directly in an index. Past performance does not guarantee future results.
Source: Bloomberg. Data as of 12/31/24. Index returns are for illustrative purposes only and do not represent actual Fund performance. Index returns do not reflect any management fees, transaction costs or expenses. Indexes are unmanaged and one cannot invest directly in an index. Past performance does not guarantee future results.
The Upshot: The Potential for a More Effective Equity Income Portfolio
Investors seeking income from their equity holdings have many approaches at their disposal. Traditionally, they fall into one of two main categories: high-yielding equity and derivative strategies. While both generate high current income, they typically sacrifice long-term total return to do it. A new advancement in covered call strategies—using daily call options—has created a new and potentially more effective way to generate equity income in a portfolio.
New Equity Income: Dividend Growth and Daily Covered Call Strategies
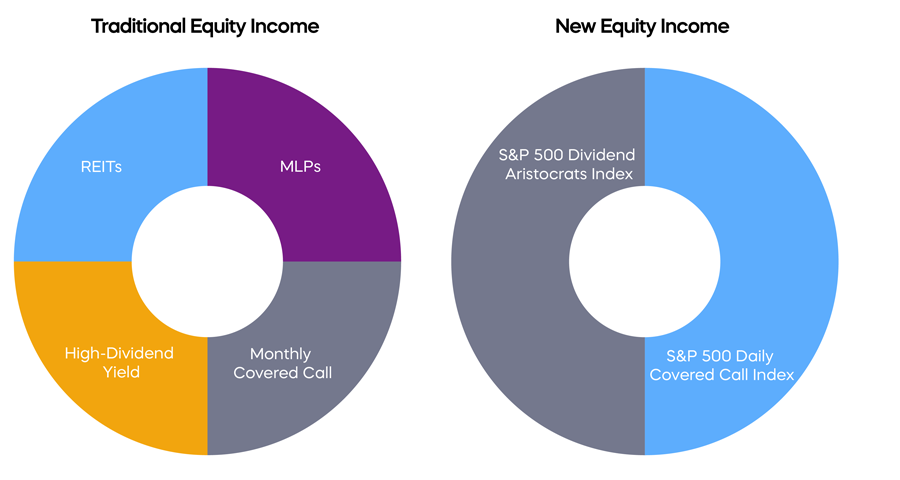
Source: Bloomberg. Data as of 12/31/24. The sample portfolios shown are for illustrative purposes only and are not intended as investment advice. Indexes are unmanaged, and one cannot invest directly in an index. Past performance does not guarantee future results.
Combining a strategy based on quality dividend growth with a strategy based on daily call options might avoid the perils of stretching for yield, deliver an attractive income stream now, grow income over time, and do it all without sacrificing total return.
[1] The fund has very limited performance history, which should not be taken as an indication of future performance.
[2] The Annualized Distribution Rate is the annualized payout, expressed as a percentage of NAV, that an investor would receive, assuming that the latest monthly distribution remained the same over the next 12 months. Distributions include return of capital, as well as ordinary dividends and capital gains. See 19a-1 notice for estimated percentage of return of capital. Distributions will reduce the NAV by the amount of the distribution. The Annualized Distribution Rate reflects a single distribution only and does not indicate total returns or any other distribution. Future distributions may differ significantly from the latest distribution and are not guaranteed. Actual sources of the distributions may vary at the end of the year, and will be provided in a Form 1099-DIV.
Learn More
ISPY
S&P 500 High Income ETF
ProShares S&P 500 High Income ETF seeks investment results, before fees and expenses, that track the performance of the S&P 500 Daily Covered Call Index.
IQQQ
Nasdaq-100 High Income ETF
ProShares Nasdaq-100 High Income ETF seeks investment results, before fees and expenses, that track the performance of the Nasdaq-100 Daily Covered Call Index.
ITWO
Russell 2000 High Income ETF
ProShares Russell 2000 High Income ETF seeks investment results, before fees and expenses, that track the performance of the Cboe Russell 2000 Daily Covered Call Index.
NOBL
S&P 500 Dividend Aristocrats ETF
Seeks investment results, before fees and expenses, that track the performance of the S&P 500® Dividend Aristocrats® Index.
REGL
S&P MidCap 400 Dividend Aristocrats ETF
Seeks investment results, before fees and expenses, that track the performance of the S&P MidCap 400® Dividend Aristocrats® Index.
SMDV
Russell 2000 Dividend Growers ETF
Seeks investment results, before fees and expenses, that track the performance of the Russell 2000® Dividend Growth Index.
TMDV
Russell U.S. Dividend Growers ETF
Seeks investment results, before fees and expenses, that track the performance of the Russell 3000® Dividend Elite Index.
TDV
S&P Technology Dividend Aristocrats ETF
ProShares S&P Technology Dividend Aristocrats ETF seeks investment results, before fees and expenses, that track the performance of the S&P® Technology Dividend Aristocrats® Index.
EFAD
MSCI EAFE Dividend Growers ETF
Seeks investment results, before fees and expenses, that track the performance of the MSCI EAFE Dividend Masters Index.
EUDV
MSCI Europe Dividend Growers ETF
Seeks investment results, before fees and expenses, that track the performance of the MSCI Europe Dividend Masters Index.
EMDV
MSCI Emerging Markets Dividend Growers ETF
Seeks investment results, before fees and expenses, that track the performance of the MSCI Emerging Markets Dividend Masters Index.